The only autonomous intelligence, built for BTC.
A self-contained, AI-driven algorithmic trading platform for a closed circle of Australian capital partners and PhD quants — no public access, no human emotion, no compromise.
Zero Theorem is not a trading tool. It is a closed autonomous intelligence that removes human emotion, bias and intervention from the most volatile asset class on earth — built for serious capital, accessible only by invitation.
Zero Sum
A game-theoretic engine positions capital to be on the right side of every trade — exploiting inefficiencies before human traders react.
Game Theory · BTC DominanceZero Entropy
A Deep Reinforcement Learning agent continuously re-optimises to reduce portfolio entropy — tightening risk, preserving capital.
DRL · Risk MinimisationZero Interference
The most dangerous variable is the human operating the system. ZT removes it entirely — 24/7 execution, no emotional override.
Autonomous · 24/7A closed loop that never sleeps.
Six moves run continuously, with no human in the loop — each one feeding the intelligence that powers the next.
Ingest
Macro, micro and on-chain signals stream into the engine.
Model
1,000+ trained variants score the market in parallel.
Select
The DRL agent surfaces the highest-confidence model.
Execute
Capital is positioned 24/7 — no emotion, no delay.
Optimise
Live results re-tune parameters against the backtest floor.
Report
Proof surfaces to partners in real time — nothing hidden.
Exclusivity is the trust signal.
No sign-up, no funnel. Access is granted by invitation only — scarcity, not marketing, is what attracts serious capital.
Radical transparency, closed access.
Everything about how the system works is visible; who gets to see it is controlled. Opacity creates anxiety — proof dissolves it.
437K backtested · 2.51 Sharpe.
A control-room dashboard that withstands scrutiny from both HNW investors and PhD-level quants — simultaneously.
Nothing like this exists anywhere.
The tools available to even the most sophisticated traders were built for human decision-making — and human decision-making is the problem.
Human emotion destroys returns.
AI trading demands unprecedented proof.
A control room that operates capital, not a website that describes it.
Capital in. Proof out.
Every user goal laddered to a business outcome that raises and retains serious capital.
Attract serious capital through scarcity, not ads. Qualified partners
Prove returns beyond doubt to win commitment. Backtest credibility
Run autonomously 24/7 with zero human override. Uptime & execution
Scale the model arsenal without scaling complexity. Models in production
Partner: see proof before trusting capital to it. Time-to-proof
Partner: understand returns in plain language. Comprehension
Quant: drill into model logic and execution logs. Model transparency
Both: read the same metric at two depths. Dual-read clarity
Two users. One uncompromising system.
The platform serves Australian high-net-worth capital partners and PhD-level quantitative analysts simultaneously. Designing for both without diluting either was the central research challenge.
◎Who we studied
- HNW capital partners — sophisticated, non-technical
- Quantitative analysts — PhD-level, raw-data hungry
- The founding team — risk & access owners
⌕Methods
- Depth interviews with both audience types
- Comprehension testing of quant metrics
- Competitive teardown — found no comparable product
✦The core finding
- One Sharpe of 2.51 must read two ways at once
- "2.77× better than holding BTC" for the partner
- "Top-1% systematic fund" for the quant
What the research forced us to do.
Findings that changed the product — each paired with the move it triggered.
Proof must come before story.
Investors who saw hard backtest numbers first trusted more and converted higher than those who saw brand narrative.
One metric needs two readings.
The same Sharpe ratio must reassure a non-technical partner and satisfy a quant — at once.
Jargon created anxiety, not authority.
Raw "Sharpe / Sortino / Alpha" labels excluded partners at the moment trust mattered most.
An inventory is not an anchor.
"1,000+ models" without "your active model is X" created uncertainty, not confidence.
Exclusivity is a feature, not a limit.
Investors don't want to join something anyone can. Scarcity is the trust signal.
It must feel operational, not informational.
Depth and live data signal that real capital is being operated, not merely described.
Everyone runs an algo. Nobody runs an arsenal.
| Capability | ZERO THEOREM | Retail platforms | Institutional desks | Single-algo bots |
|---|---|---|---|---|
| Fully autonomous, 24/7 execution | ● | — | ◐ | ● |
| 1,000+ model arsenal with DRL selection | ● | — | ◐ | — |
| Emotion-free, zero human override | ● | — | — | ● |
| Real-time proof + model transparency | ● | ◐ | ◐ | — |
| Dual-audience (partner + quant) UX | ● | — | ◐ | — |
| Invite-only, qualified access | ● | — | ● | — |
No comparable product exists in this category. Retail overwhelms with noise; institutional desks need armies of analysts; single-algo bots run one strategy. ZT runs a full arsenal, autonomously, with proof — that white space is the product.
Two audiences. One screen.
Margaret, 52
● Pain Points
- Sophisticated investor, no trading background
- Jargon erodes trust at the worst moment
- Needs proof before committing capital
- Wants capital preservation, not thrills
● Goals
- Above-market returns with clear risk
- Plain-language reads of every metric
- Dividend & capital-return clarity
- Confidence the system is in control
"Show me 2.77× better than holding BTC — in words I trust — and then we'll talk capital."
— Capital partner interviewDr. Anne, 38
● Pain Points
- Most tools hide the model logic
- No access to raw factor exposure
- Backtest methodology rarely auditable
- Hand-holding UI wastes her time
● Goals
- Full model transparency & alpha attribution
- Raw data and execution logs
- Factor exposure across macro & micro
- Depth on demand, no guardrails
"A risk-adjusted return in the top 1% of systematic funds — prove it at the factor level, or it's just a number."
— Quant analyst interviewPeople don't want a dashboard.
They want certainty.
Trust the system
"When I consider committing capital, I want undeniable proof, so I can trust an autonomous system with real money."
Read it my way
"When I check performance, I want it in my language, so a partner and a quant both understand the same number."
See the engine
"When I drill in, I want full model logic, so transparency replaces blind faith."
Stay hands-off
"When the market moves, I want the system to act, so my emotion never overrides the math."
Proof, depth, and a closed door.
North star: time-to-trust — minutes from first dashboard view to a partner believing the proof. Every decision laddered to it.
Proof-first hierarchy
Backtest above the fold on every entry. Evidence before narrative, always.
Dual-read metrics
One number, two depths — contextualised for partners, raw for quants.
Operate, don't browse
Control-room density and live data — the platform feels operational, not informational.
We led with proof, not promise.
From introduction to committed capital.
Mapping action against feeling shows exactly where trust is won — and where deals stall.
A control room, not a website.
Every node in the tree is operational, not informational. You don't browse Zero Theorem — you operate it.
- Strategy Stack
- Alpha Stack
- Model Selection
- Execution State
- ZT Forecast
- Volatility Metrics
- Factor Analysis
- Macro / Micro
- 1,000+ Models
- Feature Exploration
- Baseline Model
- Generation-0
- Backtest Engine
- Optimisation
- Pay It Forward
- Returns Data
- Live P&L
- Global Correlation
- Risk Exposure
- Reporting
From introduction to provisioned dashboard.
Access is granted by invitation, and the onboarding flow doubles as the platform's primary trust signal — every partner is qualified before they ever see the engine.
Introduction
Access originates from a trusted referral within the network — no cold applications.
Qualification
Minimum investment threshold verified; suitability assessed.
Invite token
A unique cryptographic token grants access — non-transferable.
Provisioned
A dashboard configured to the partner's strategy, capital and reporting.
Scarcity
Limited access is the most powerful trust signal in a capital-raising context — the door itself builds confidence.
Control
Every user is qualified, so the dashboard is built for sophisticated partners and quants alike.
Security
A platform running live capital is provisioned per partner — security through selection.
Game theory, DRL, and zero hands.
The closed loop that no competitor replicates — a model arsenal continuously evaluated and executed without a human in the path.
Game-theoretic core
Positions capital on the right side of a zero-sum market, exploiting inefficiencies first.
DRL agent
Reinforcement learning re-optimises continuously to reduce portfolio entropy.
1,000+ models
A live arsenal scored in parallel; the highest-confidence variant goes to execution.
24/7 execution
Always on, never tired, never emotional — the human variable removed entirely.
Live optimisation
Real results re-tune parameters against the backtest floor in real time.
Total transparency
Every decision is visible — model logic, risk and proof, in real time.
The calls that defined the product.
Senior design is defensible design. Each decision below replaced an obvious-but-wrong early direction.
Backtest above the fold — everywhere
Early on, performance was buried in secondary navigation.
Data density as a feature
Sparse, oversimplified cards hid the depth operators rely on.
Dual-read metrics
Raw "Sharpe: 2.51 / Alpha: 7.28" excluded non-technical partners.
Invite-only as a feature
An open registration flow was on the table.
Principles, applied with intent.
Where established laws shaped a data-dense control room — named, and used on purpose.
Pre-select the model
More options, slower decisions.
Gravitational clusters
Related items read as a group.
Two depths, one screen
Reveal complexity on demand.
Only gold escapes
The distinct element is remembered.
Gravity buys trust
Polished systems feel more credible.
Bounded data zones
Shared borders imply relationship.
Anchor, not inventory
Working memory is limited.
Proof first & last
We remember the ends.
Dense, but never exclusionary.
Data-dense doesn't mean inaccessible. Plain-language context and high-contrast hierarchy keep a quant tool legible to a non-technical partner.
From grey grid to the event horizon.
Structure first, then hierarchy, then the black-hole skin. Fidelity climbed only as the dual-audience questions got answered.
Built from the event horizon out.
The entire brand — the name, the logo and the complete design system — is inspired by black hole theory. The logo's ring is the event horizon; the palette is the void and the single wavelength of light that escapes it. (The case-study chrome is my studio system.)
Body & descriptions · Inter
Data & system values · JetBrains Mono
The Singularity, mapped to UI.
The Singularity
Every element converges on one centre of gravity — live portfolio value and active model. Nothing competes with it.
Hawking Radiation
Gold is the only energy that escapes the void — profit, signals and critical alerts. Used sparingly, on purpose.
The Accretion Disk
Concentric rings throughout the UI reflect capital swirling inward — orbital hierarchy in hero, loaders and nav.
Gravitational Lensing
Less-important data recedes into the void; mission-critical information is bent forward and amplified.
The dashboard,
in full detail.
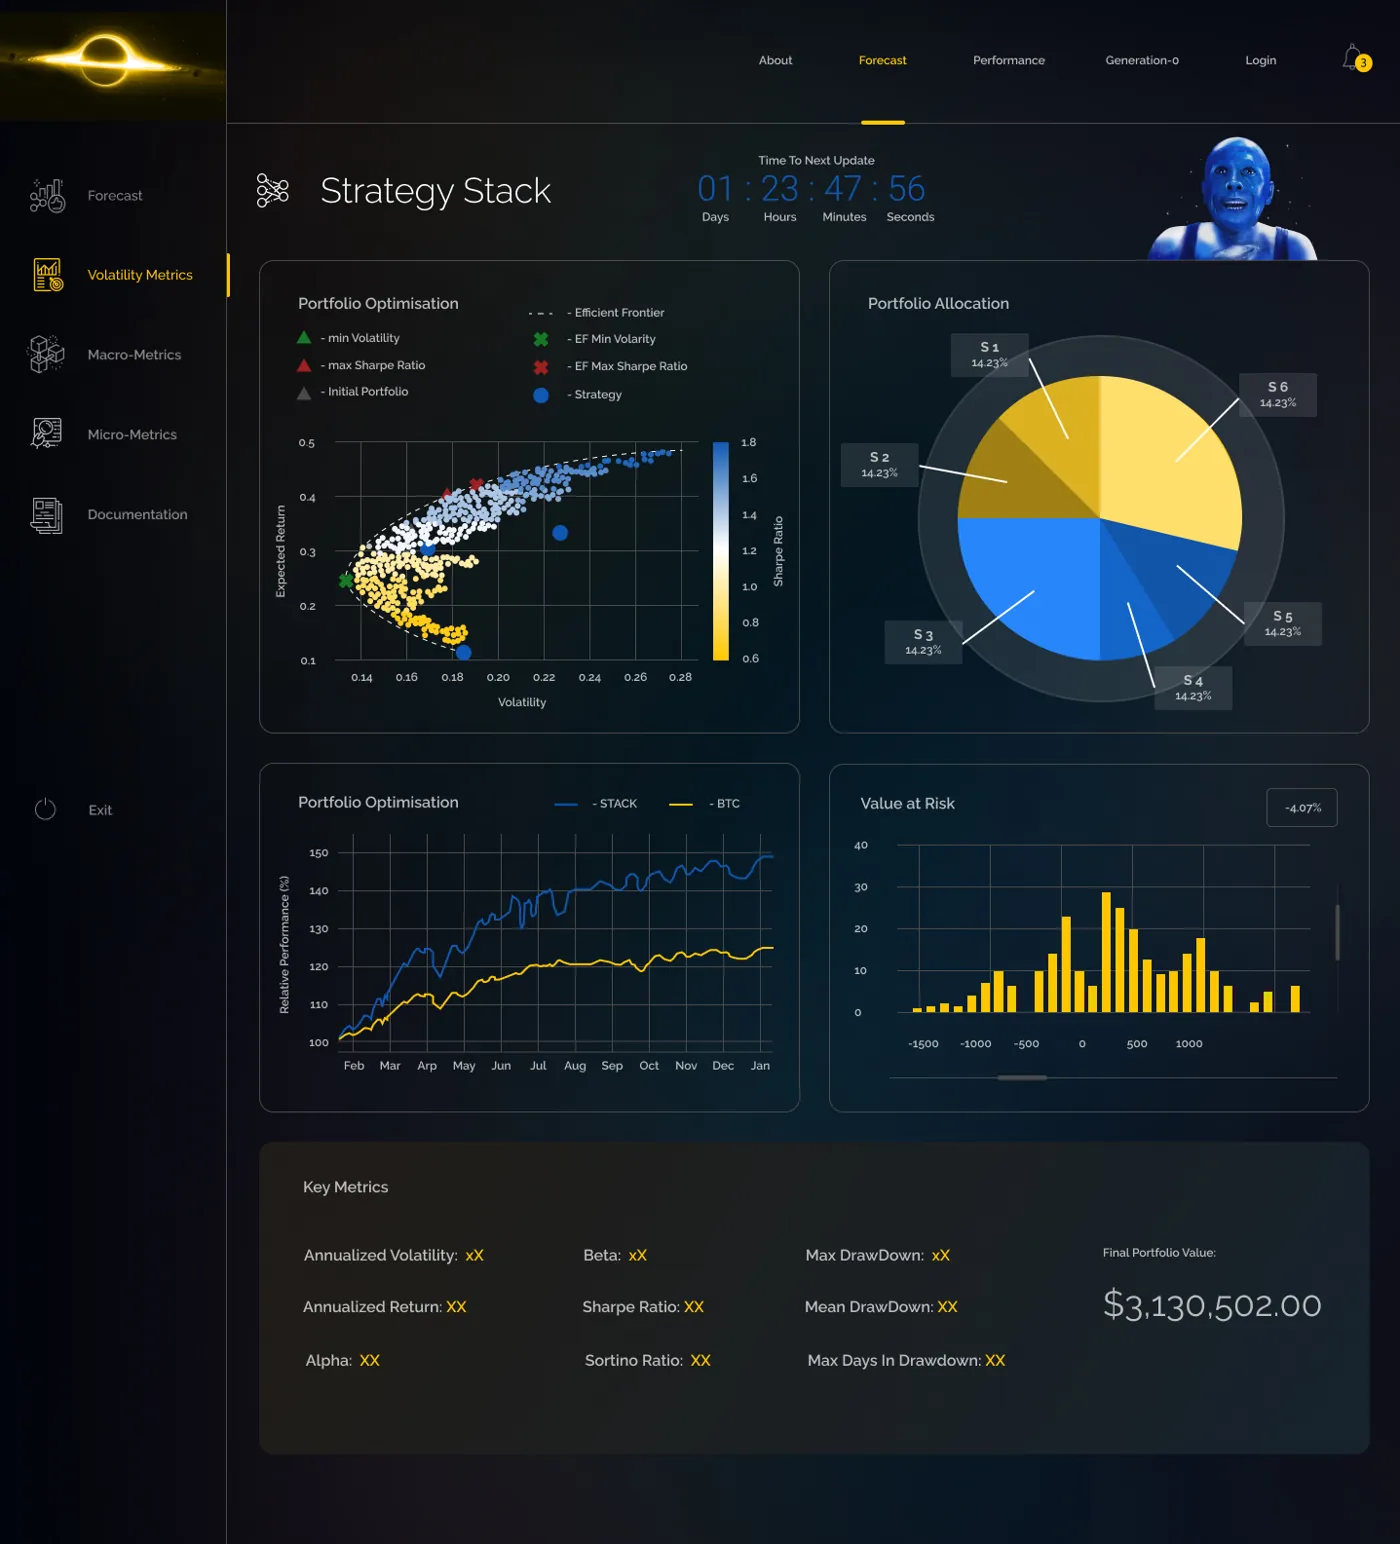
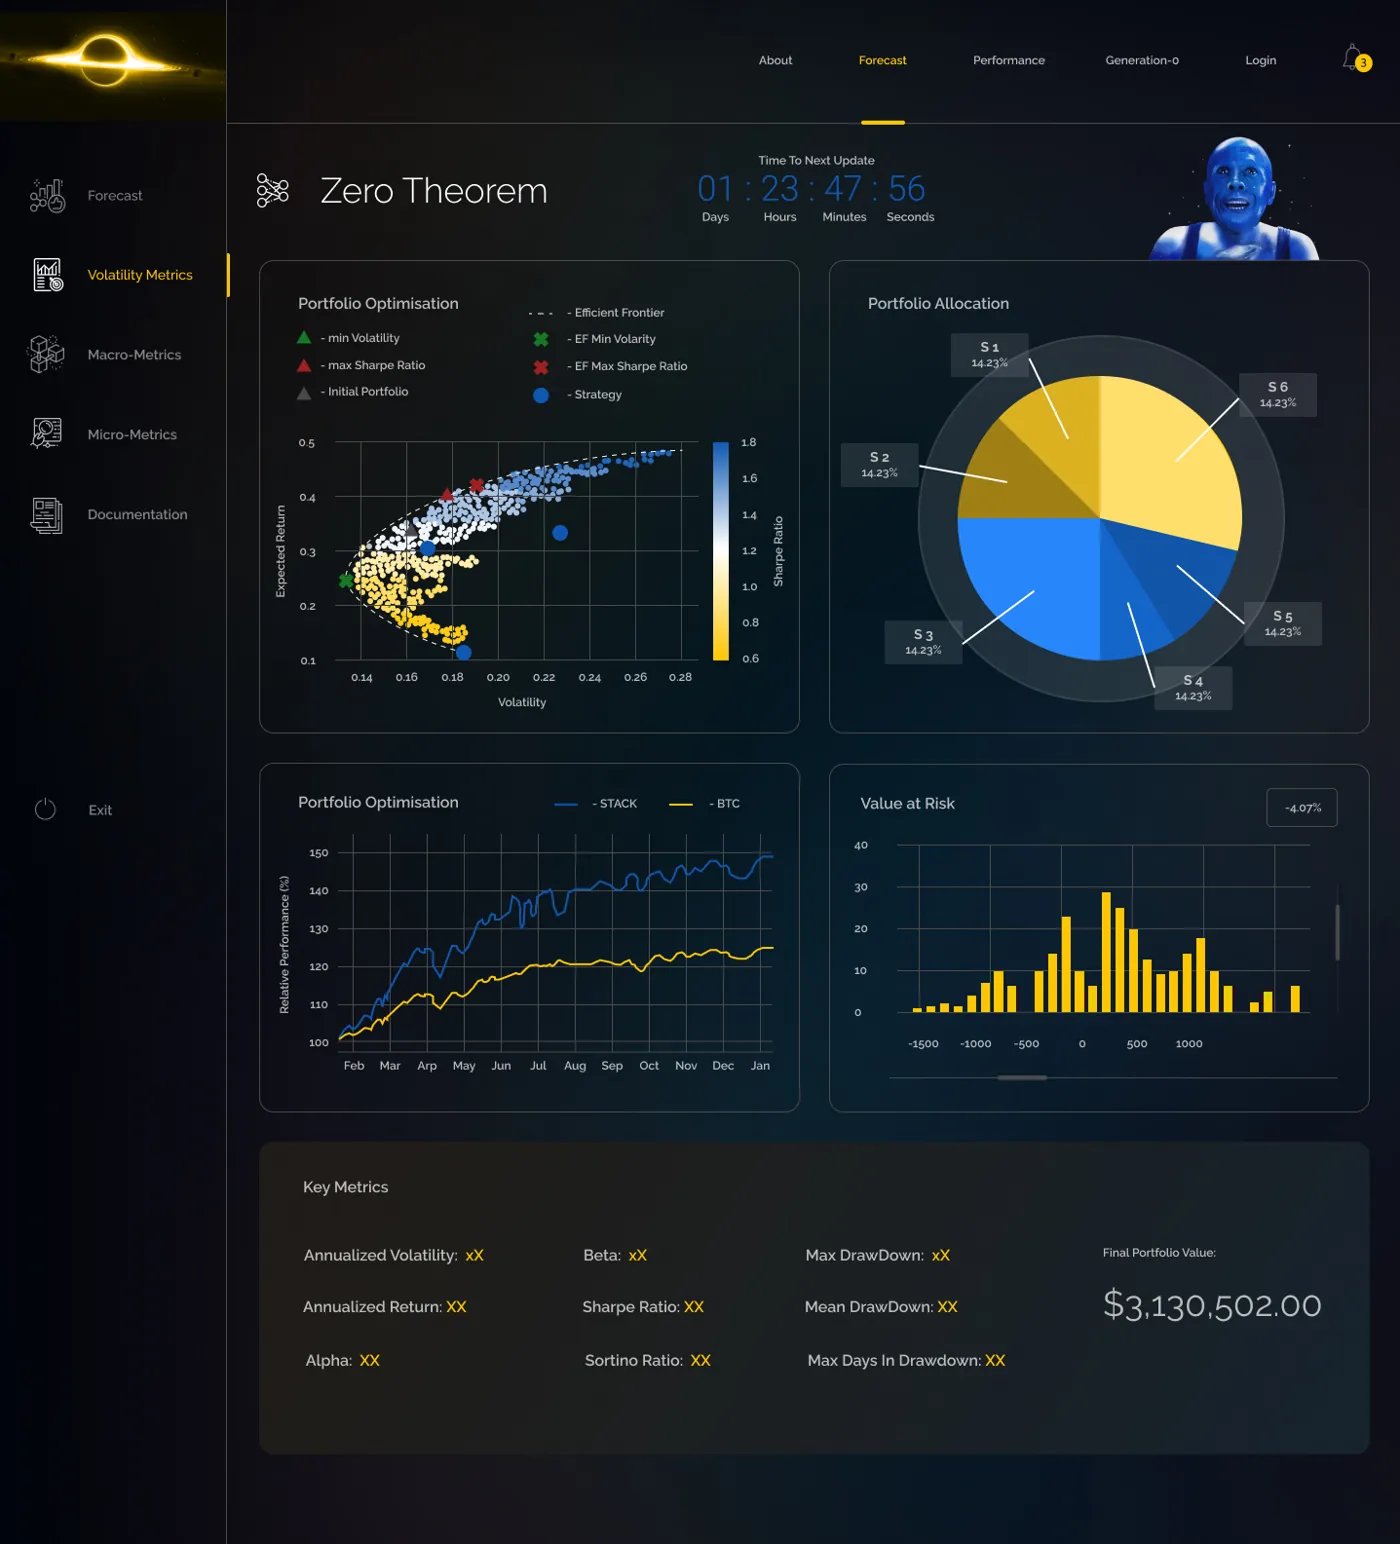
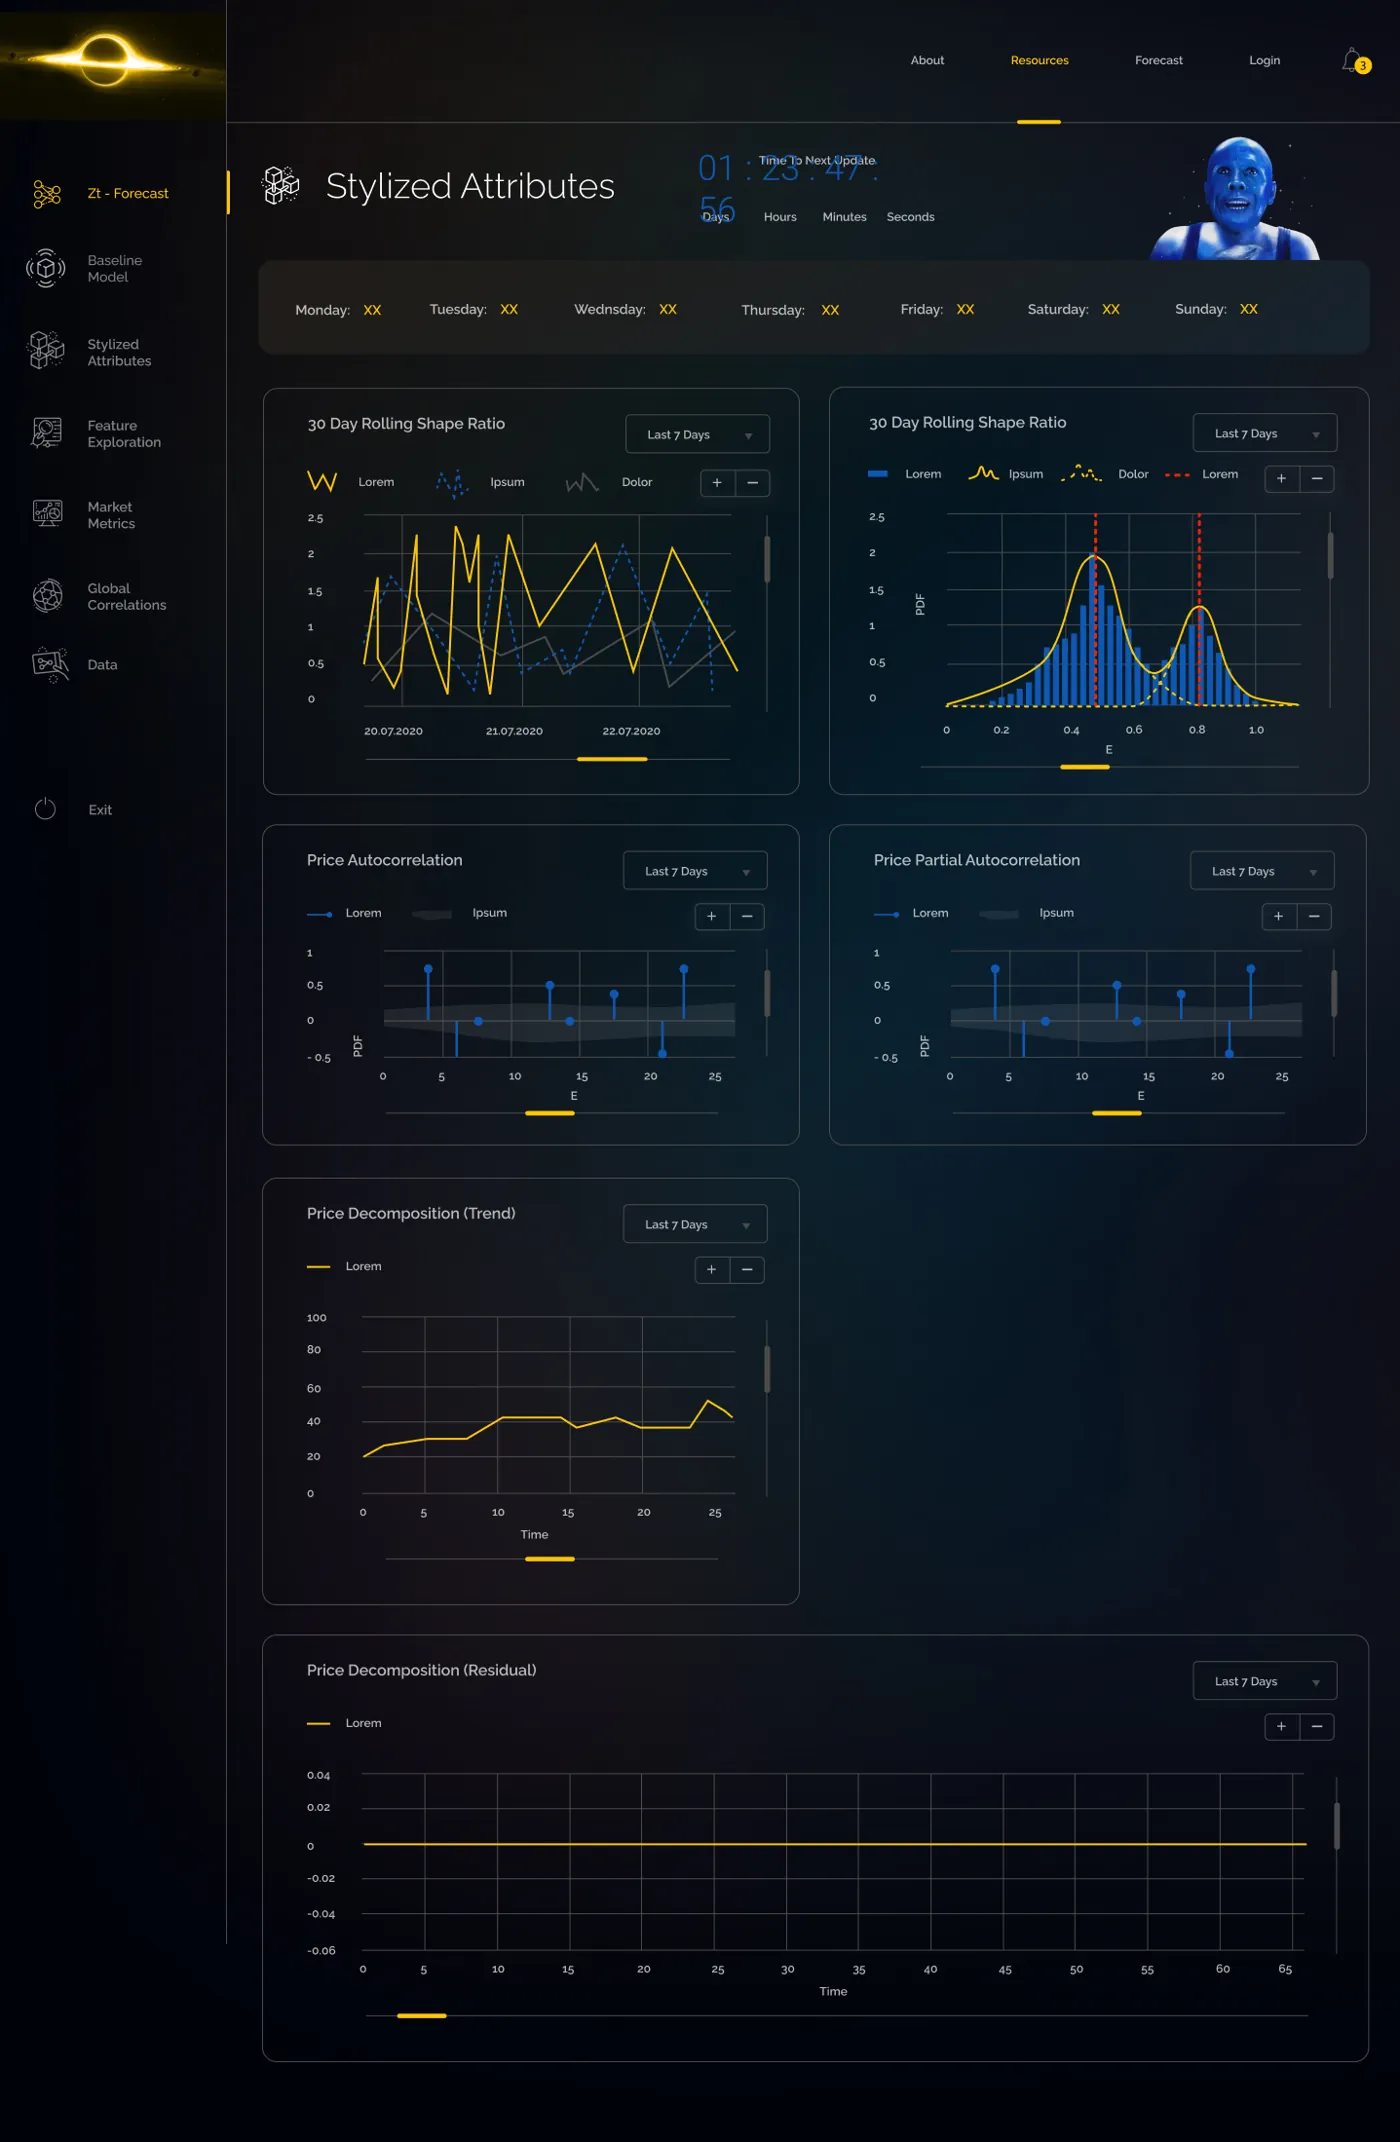
The primary strategy layer — active model allocation, weighting and live execution signals, designed for instant comprehension of portfolio position.
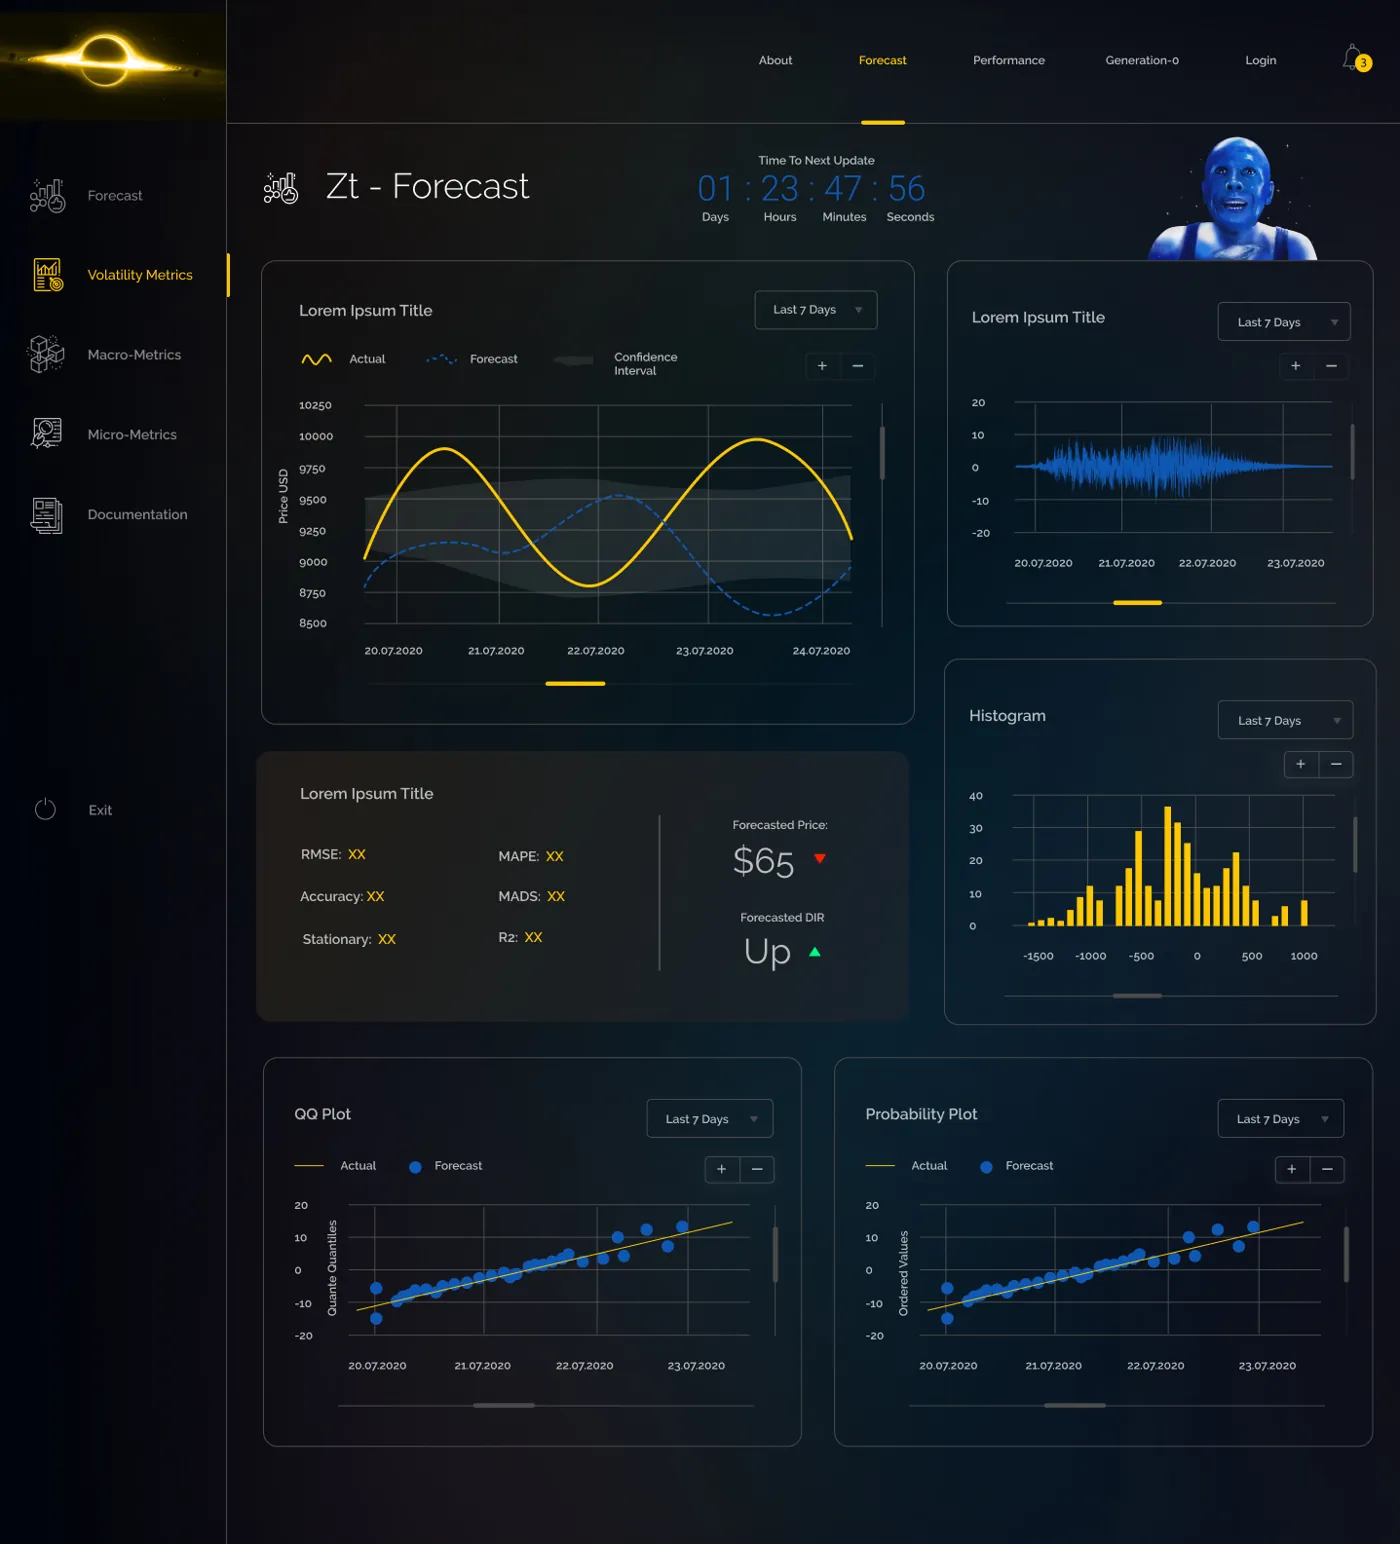
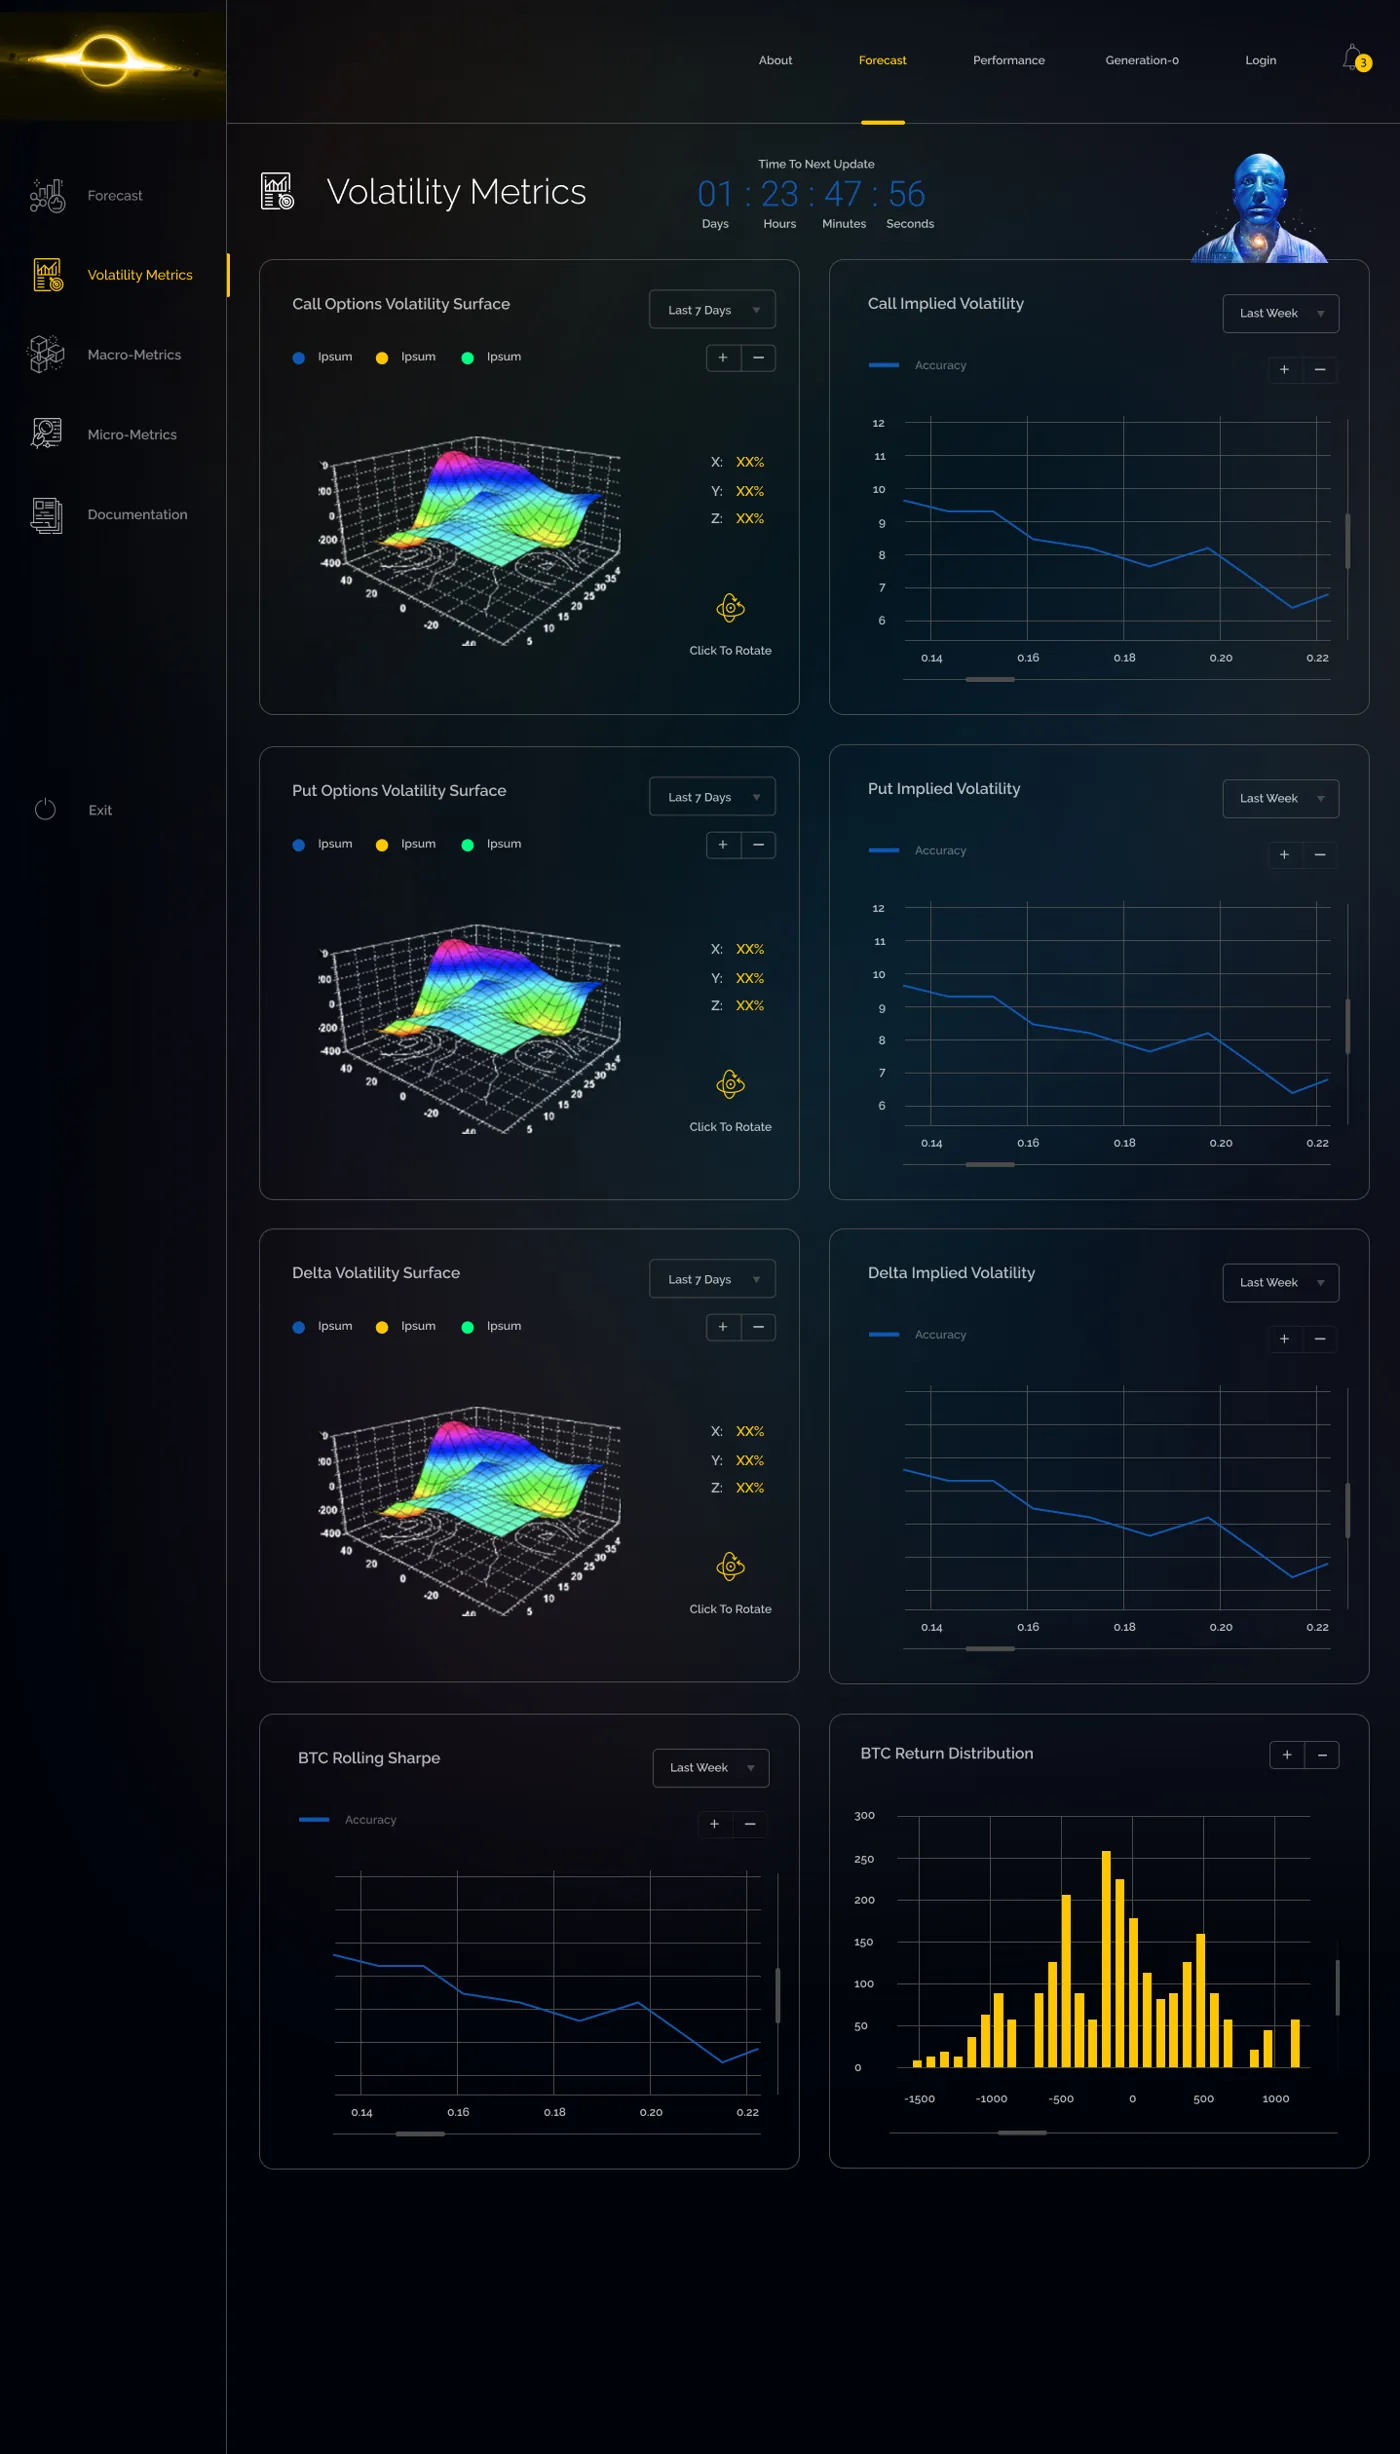
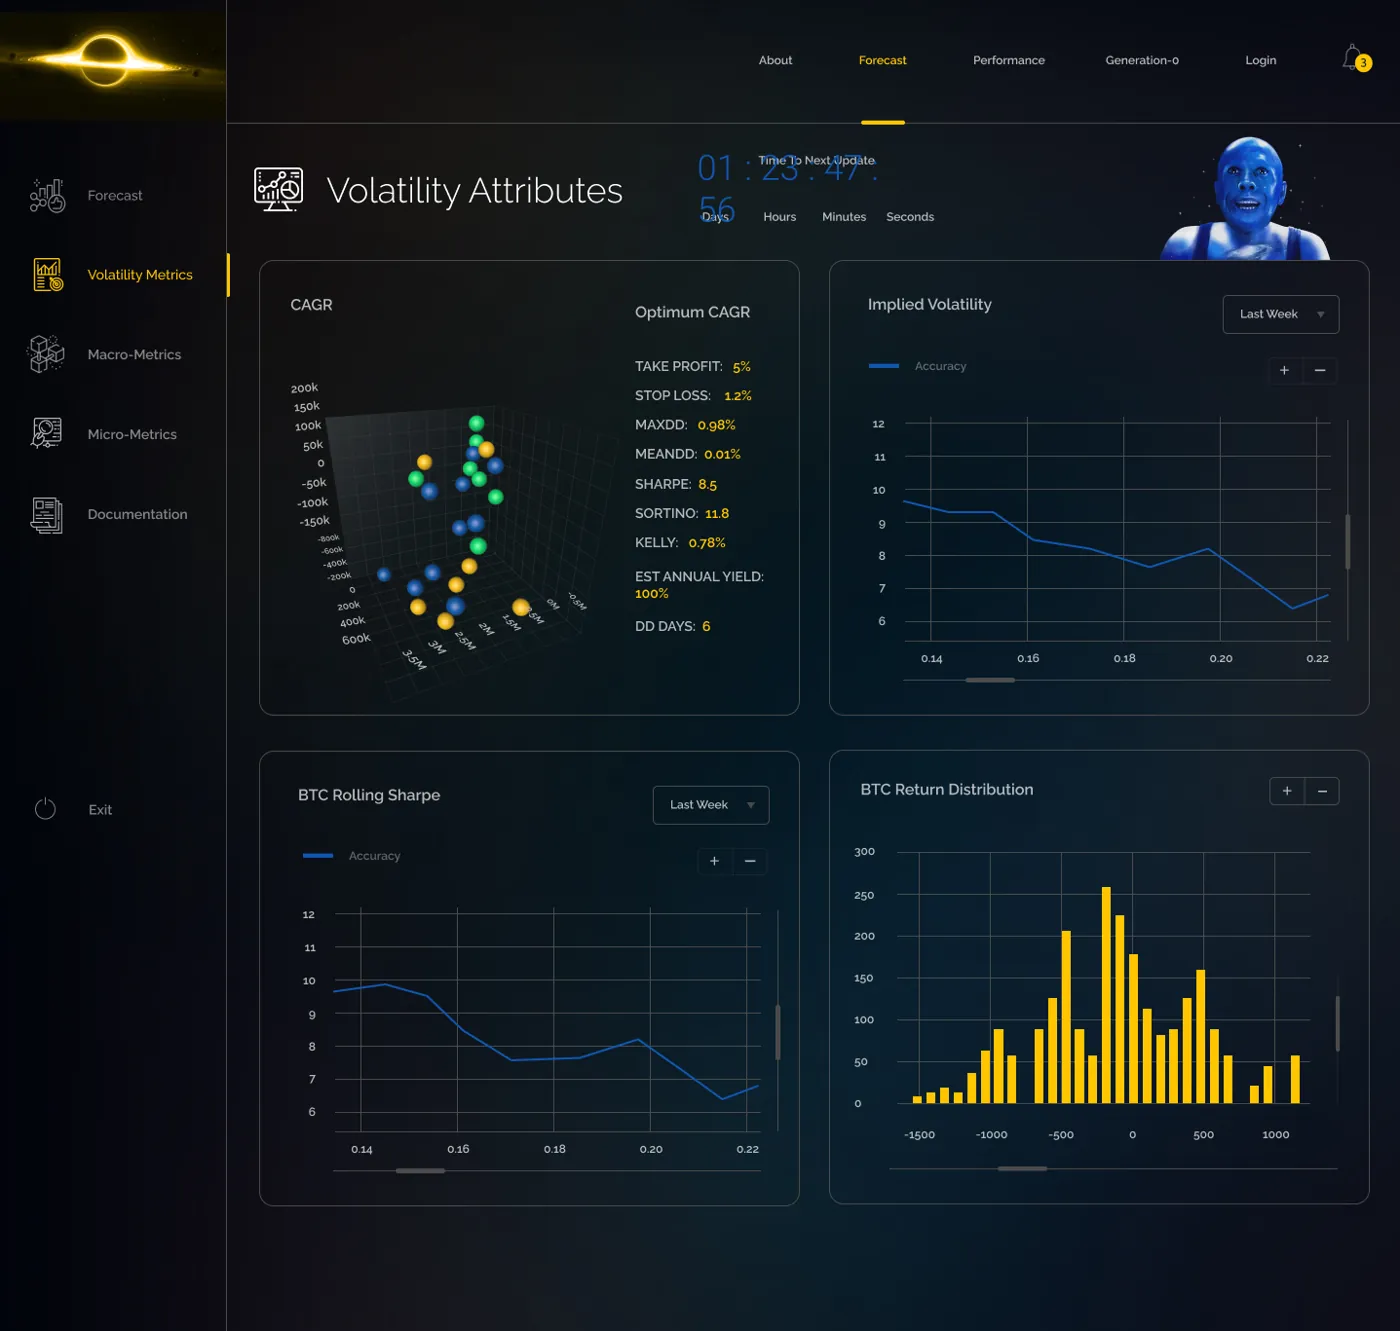
Forward-looking model output across time horizons — macro signals, volatility surfaces and factor exposures synthesised into one directional view.
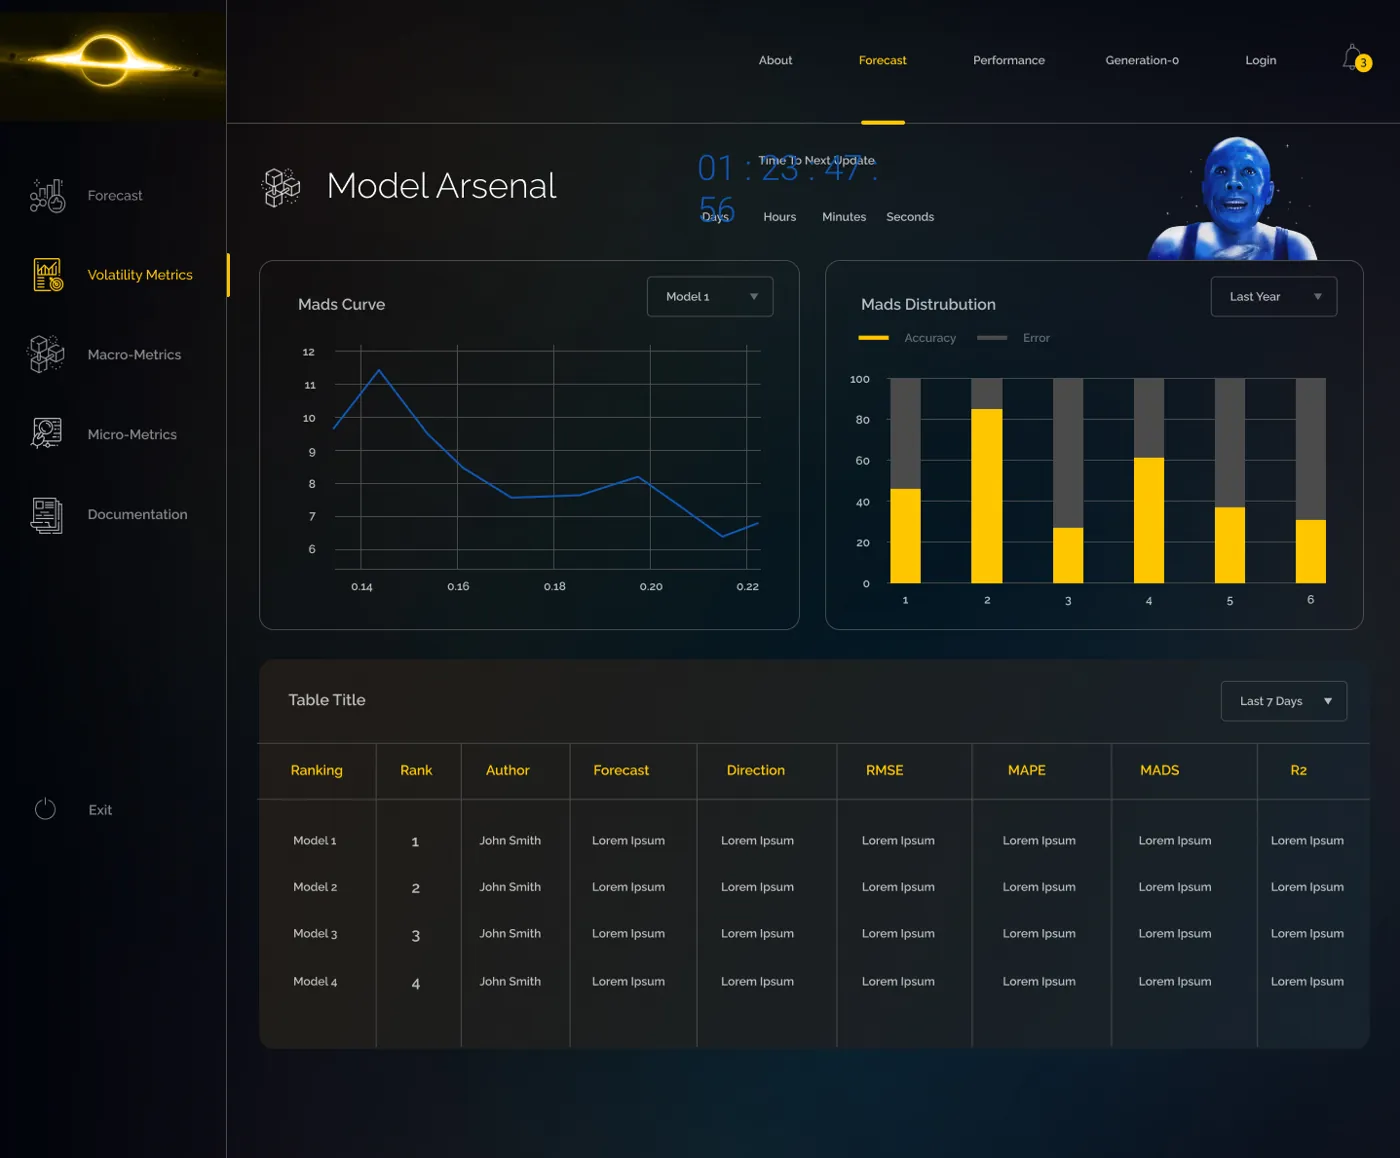
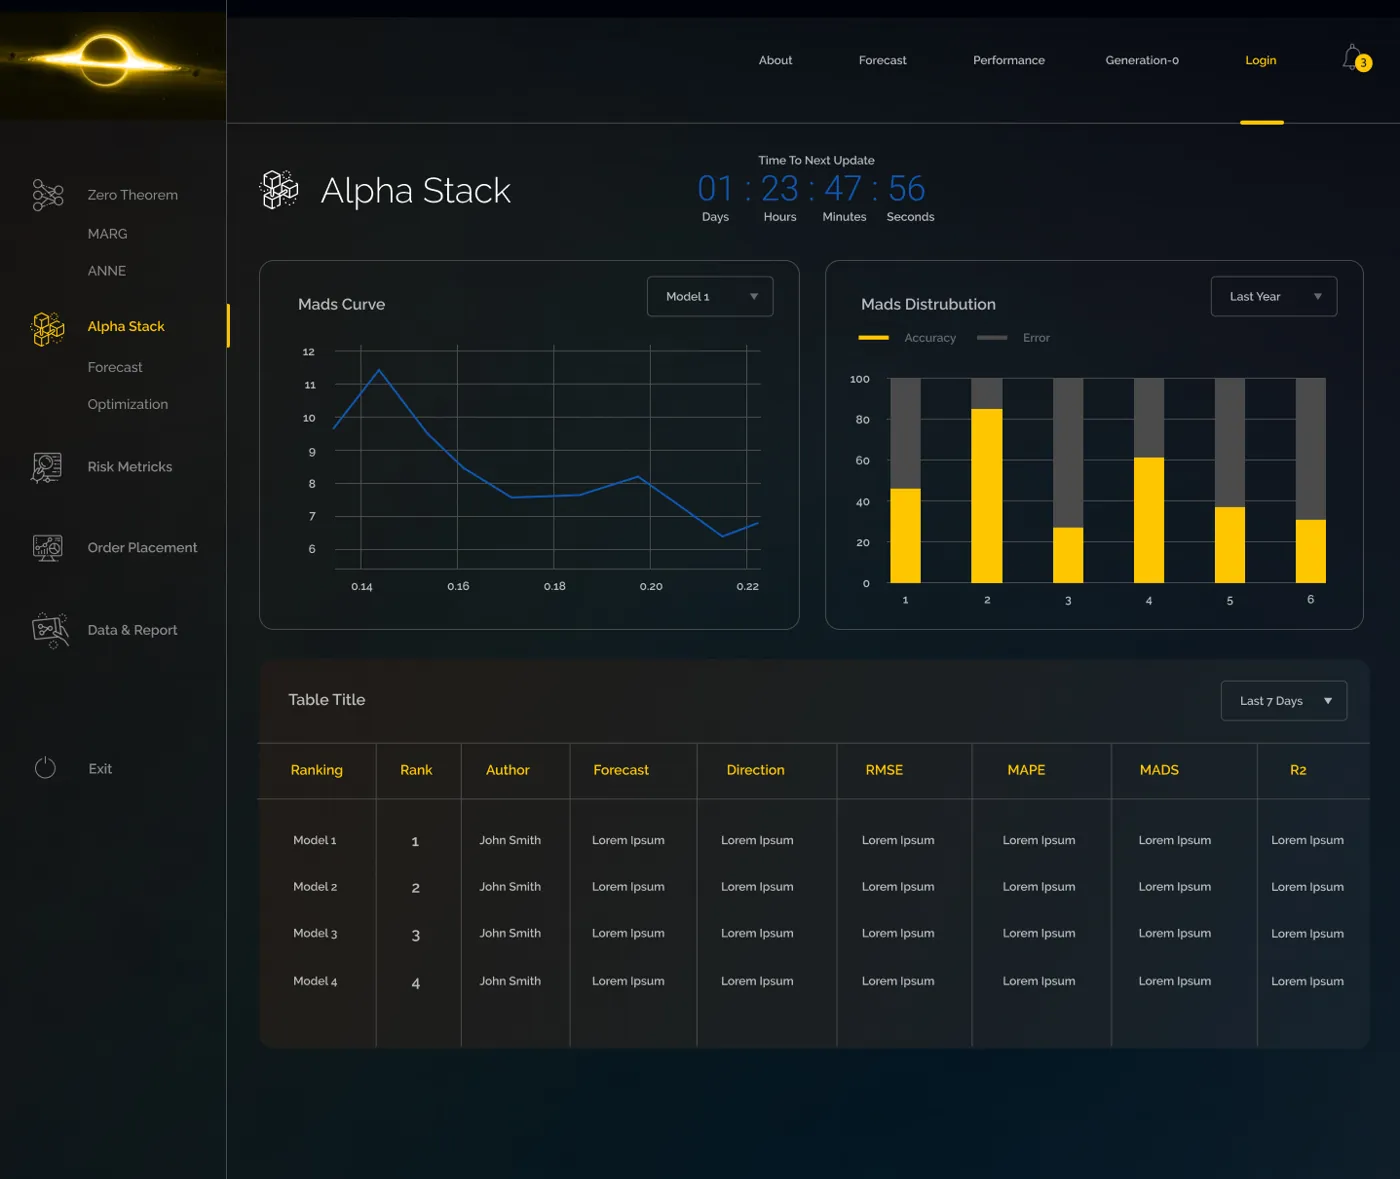
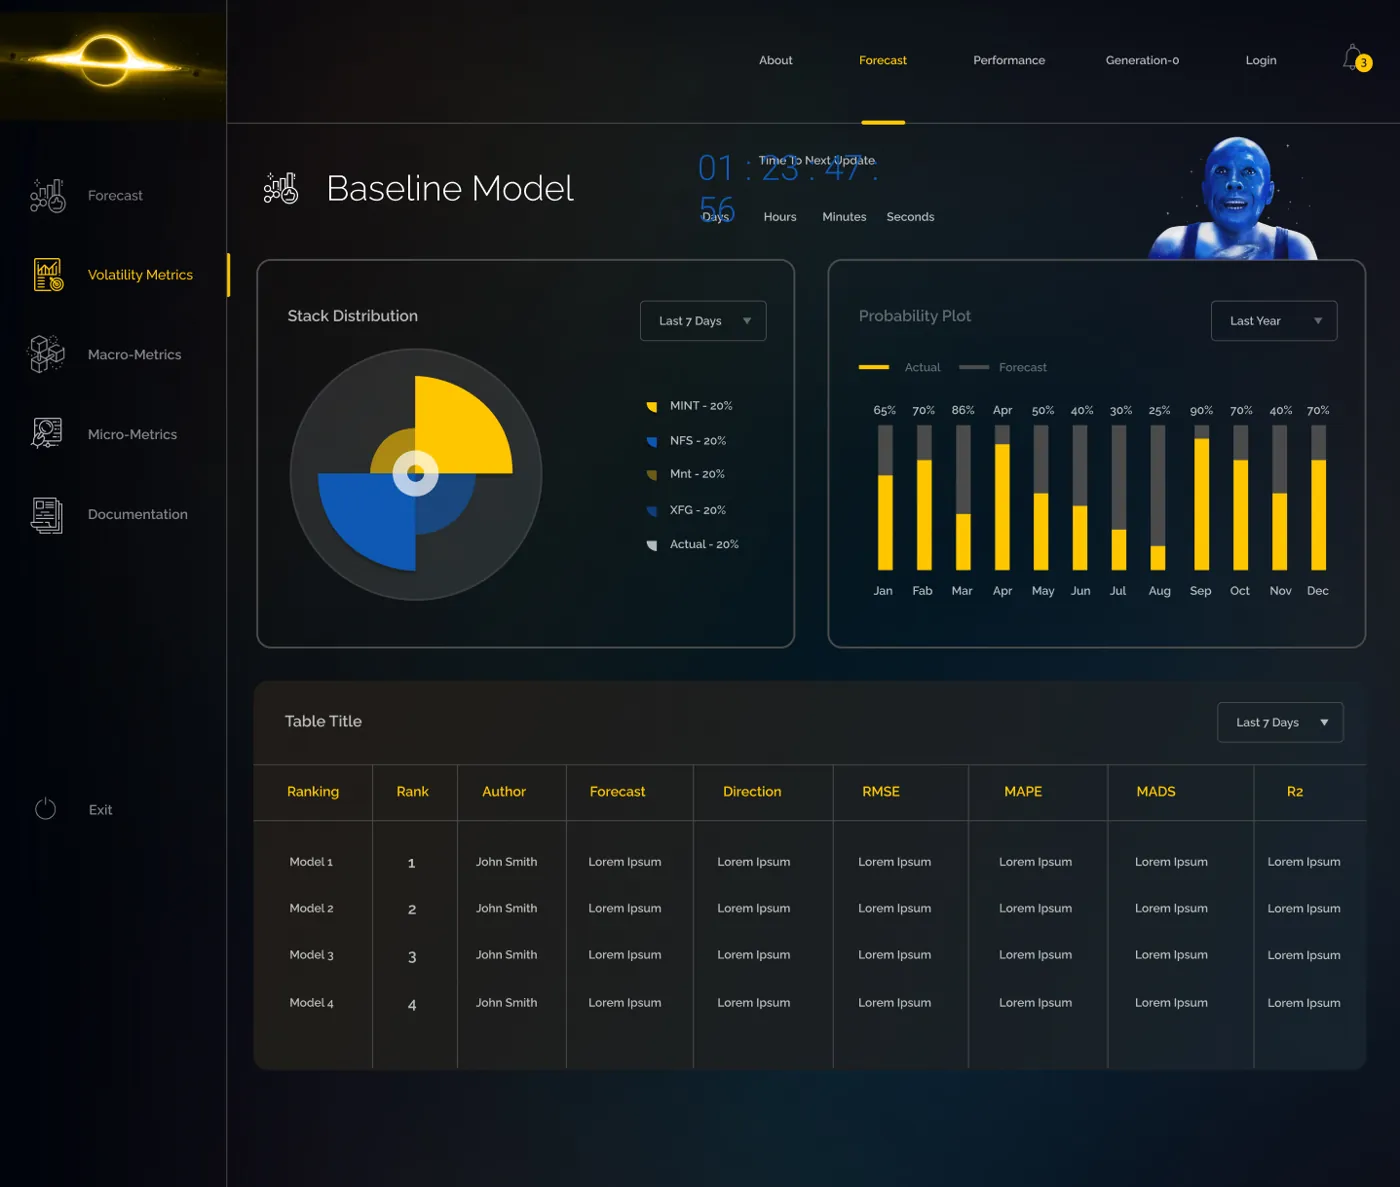
The engine room — 1,000+ trained variants, continuously evaluated, with the highest-confidence model auto-selected for live execution.
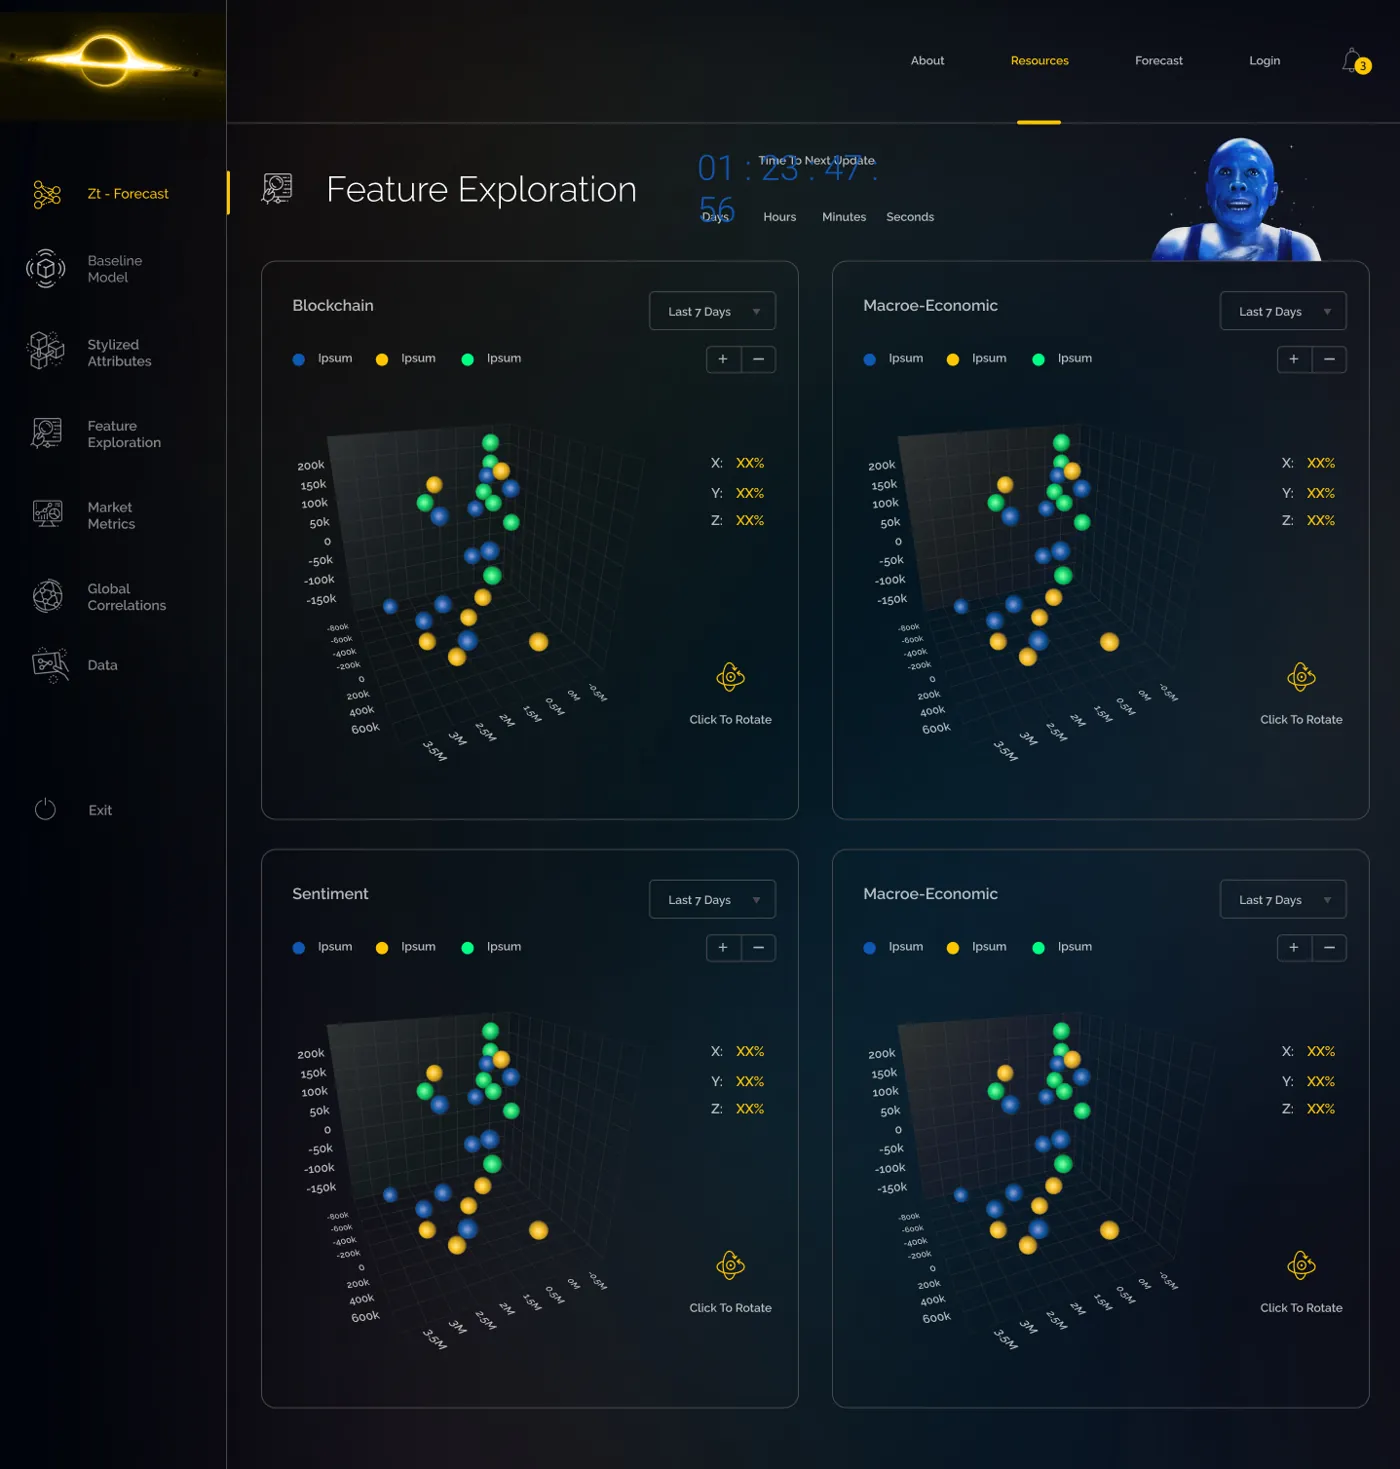
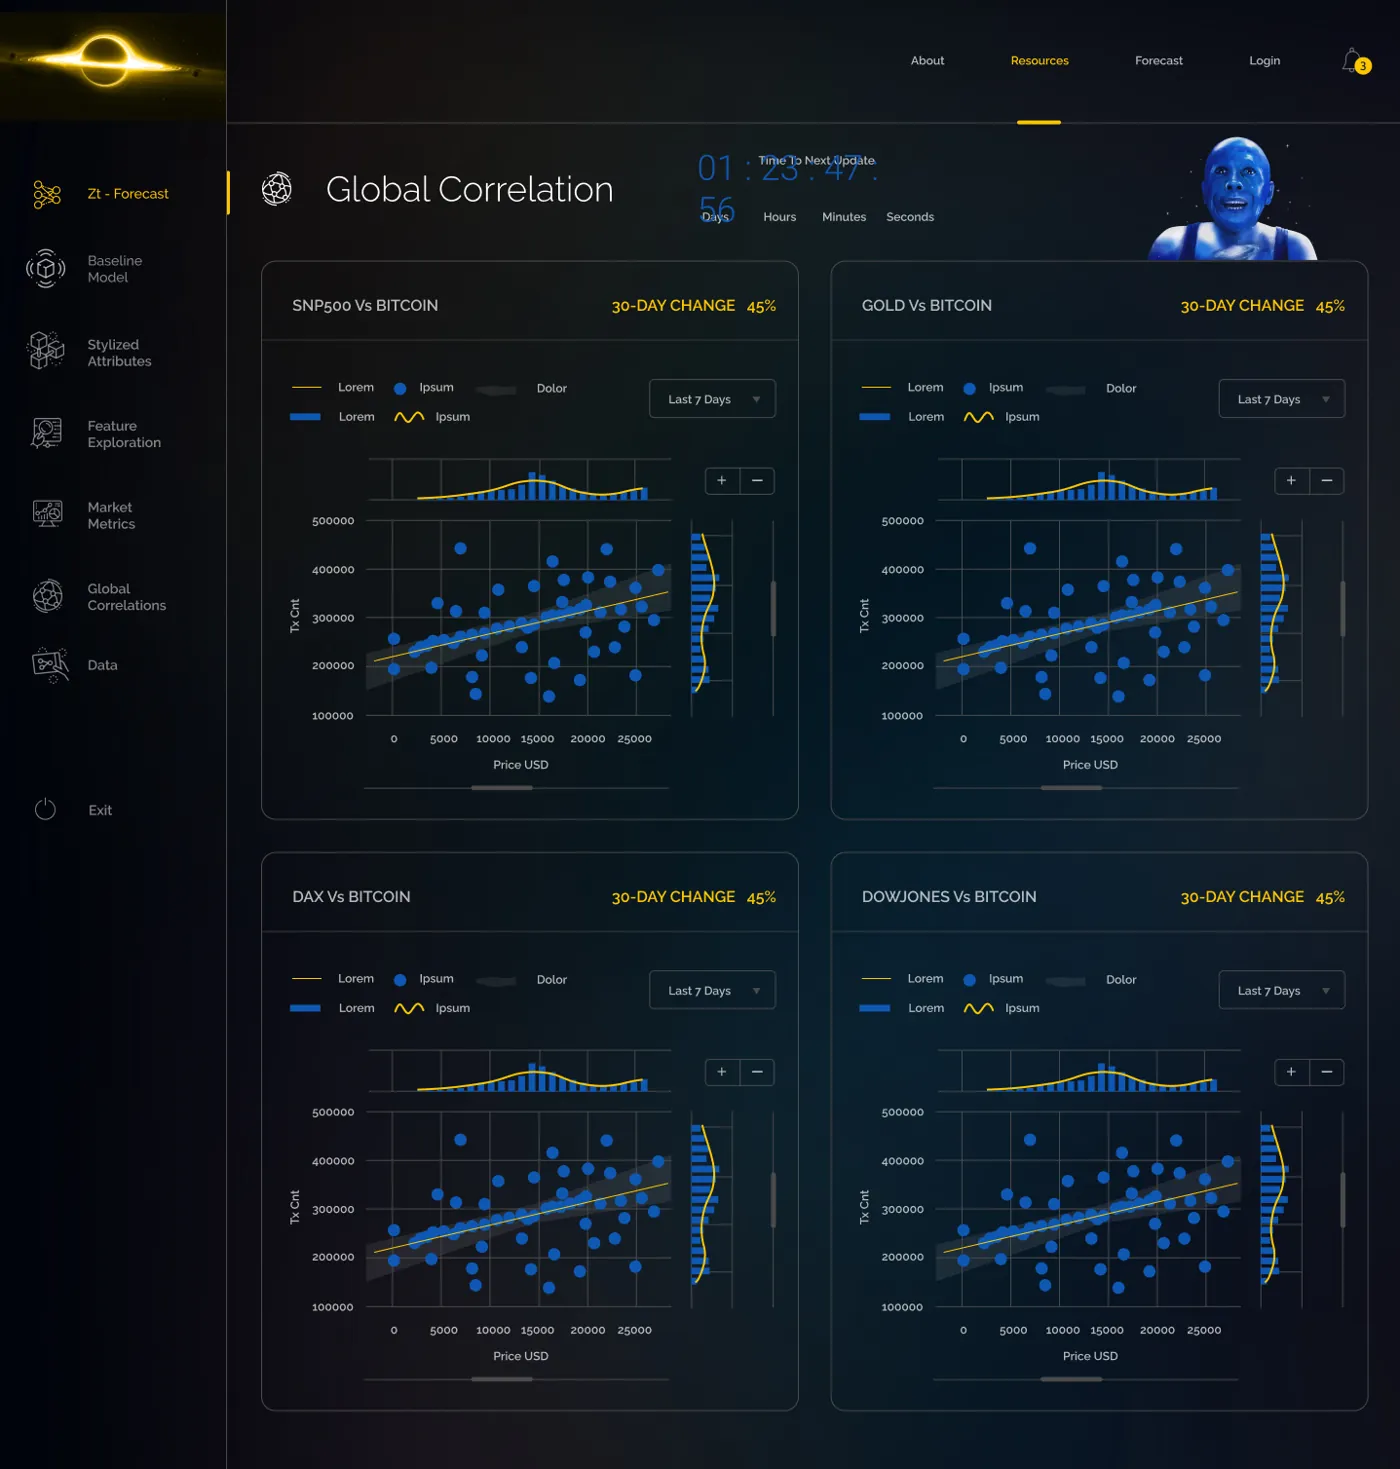
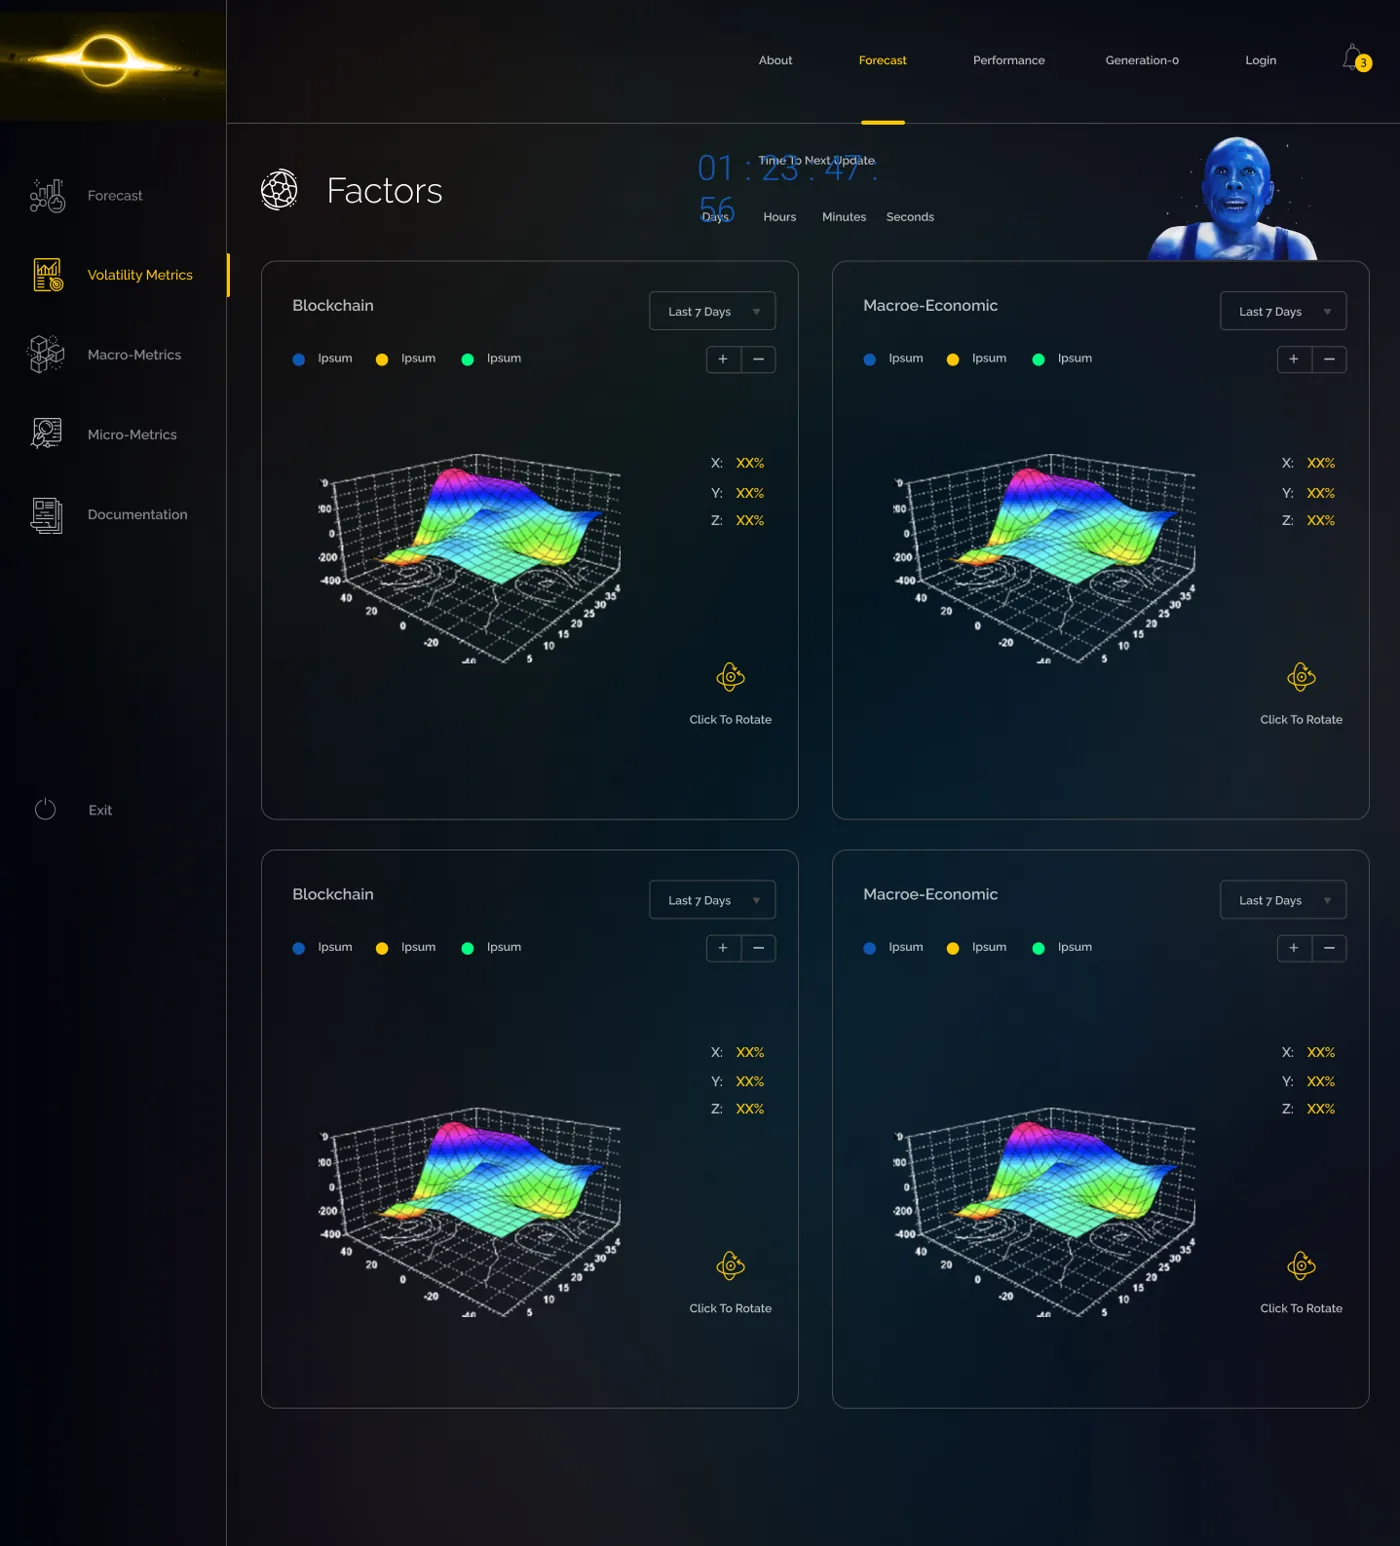
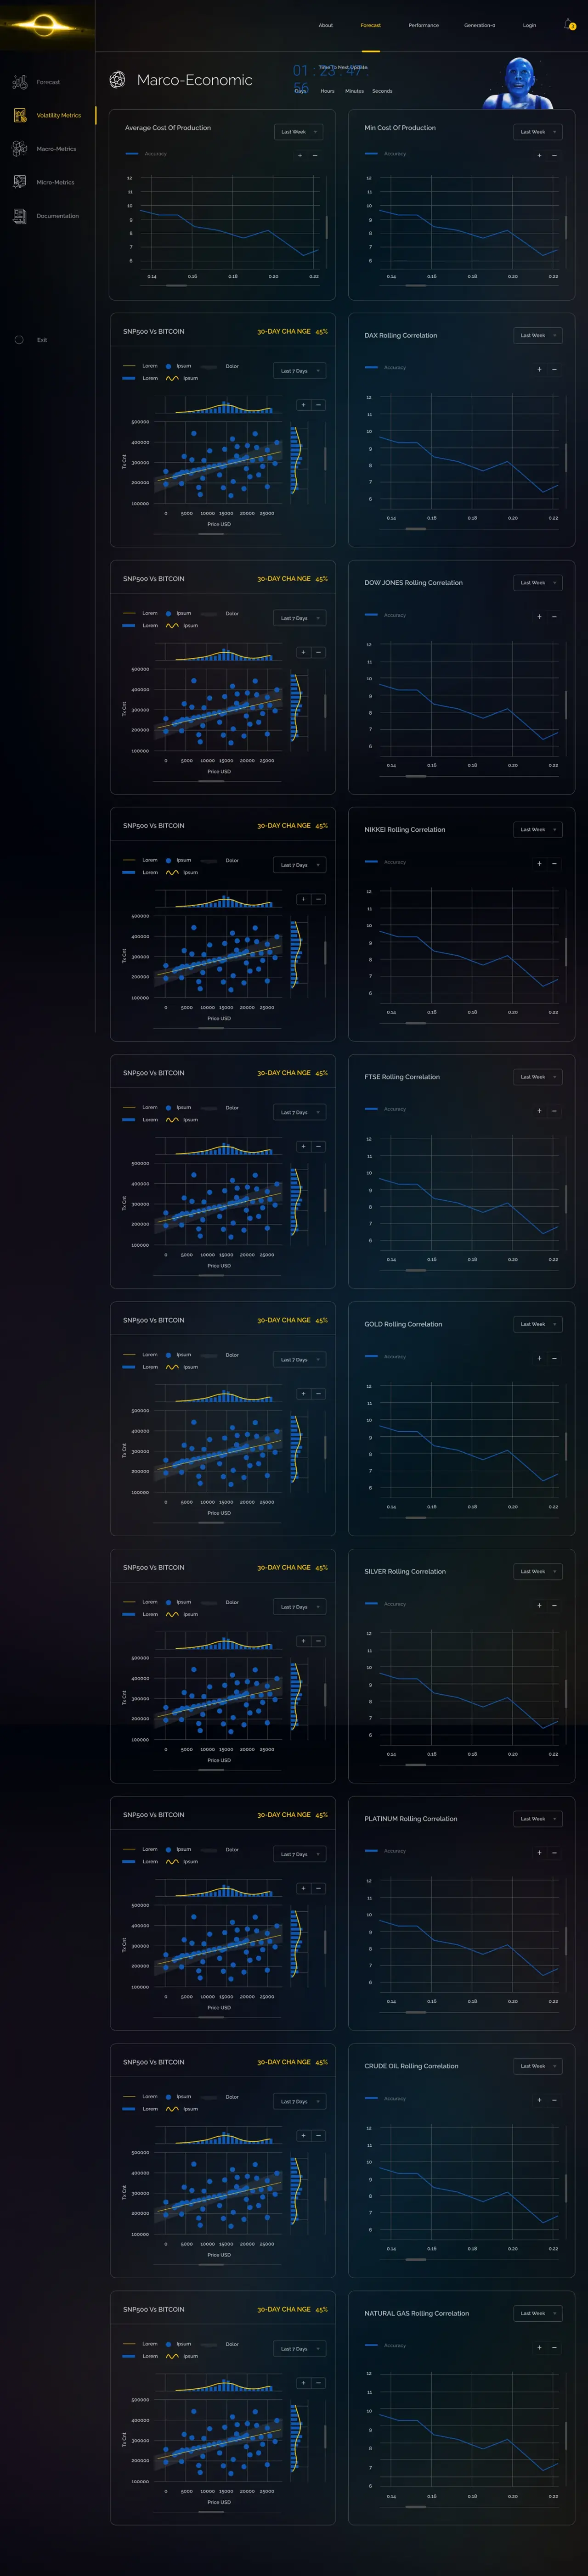
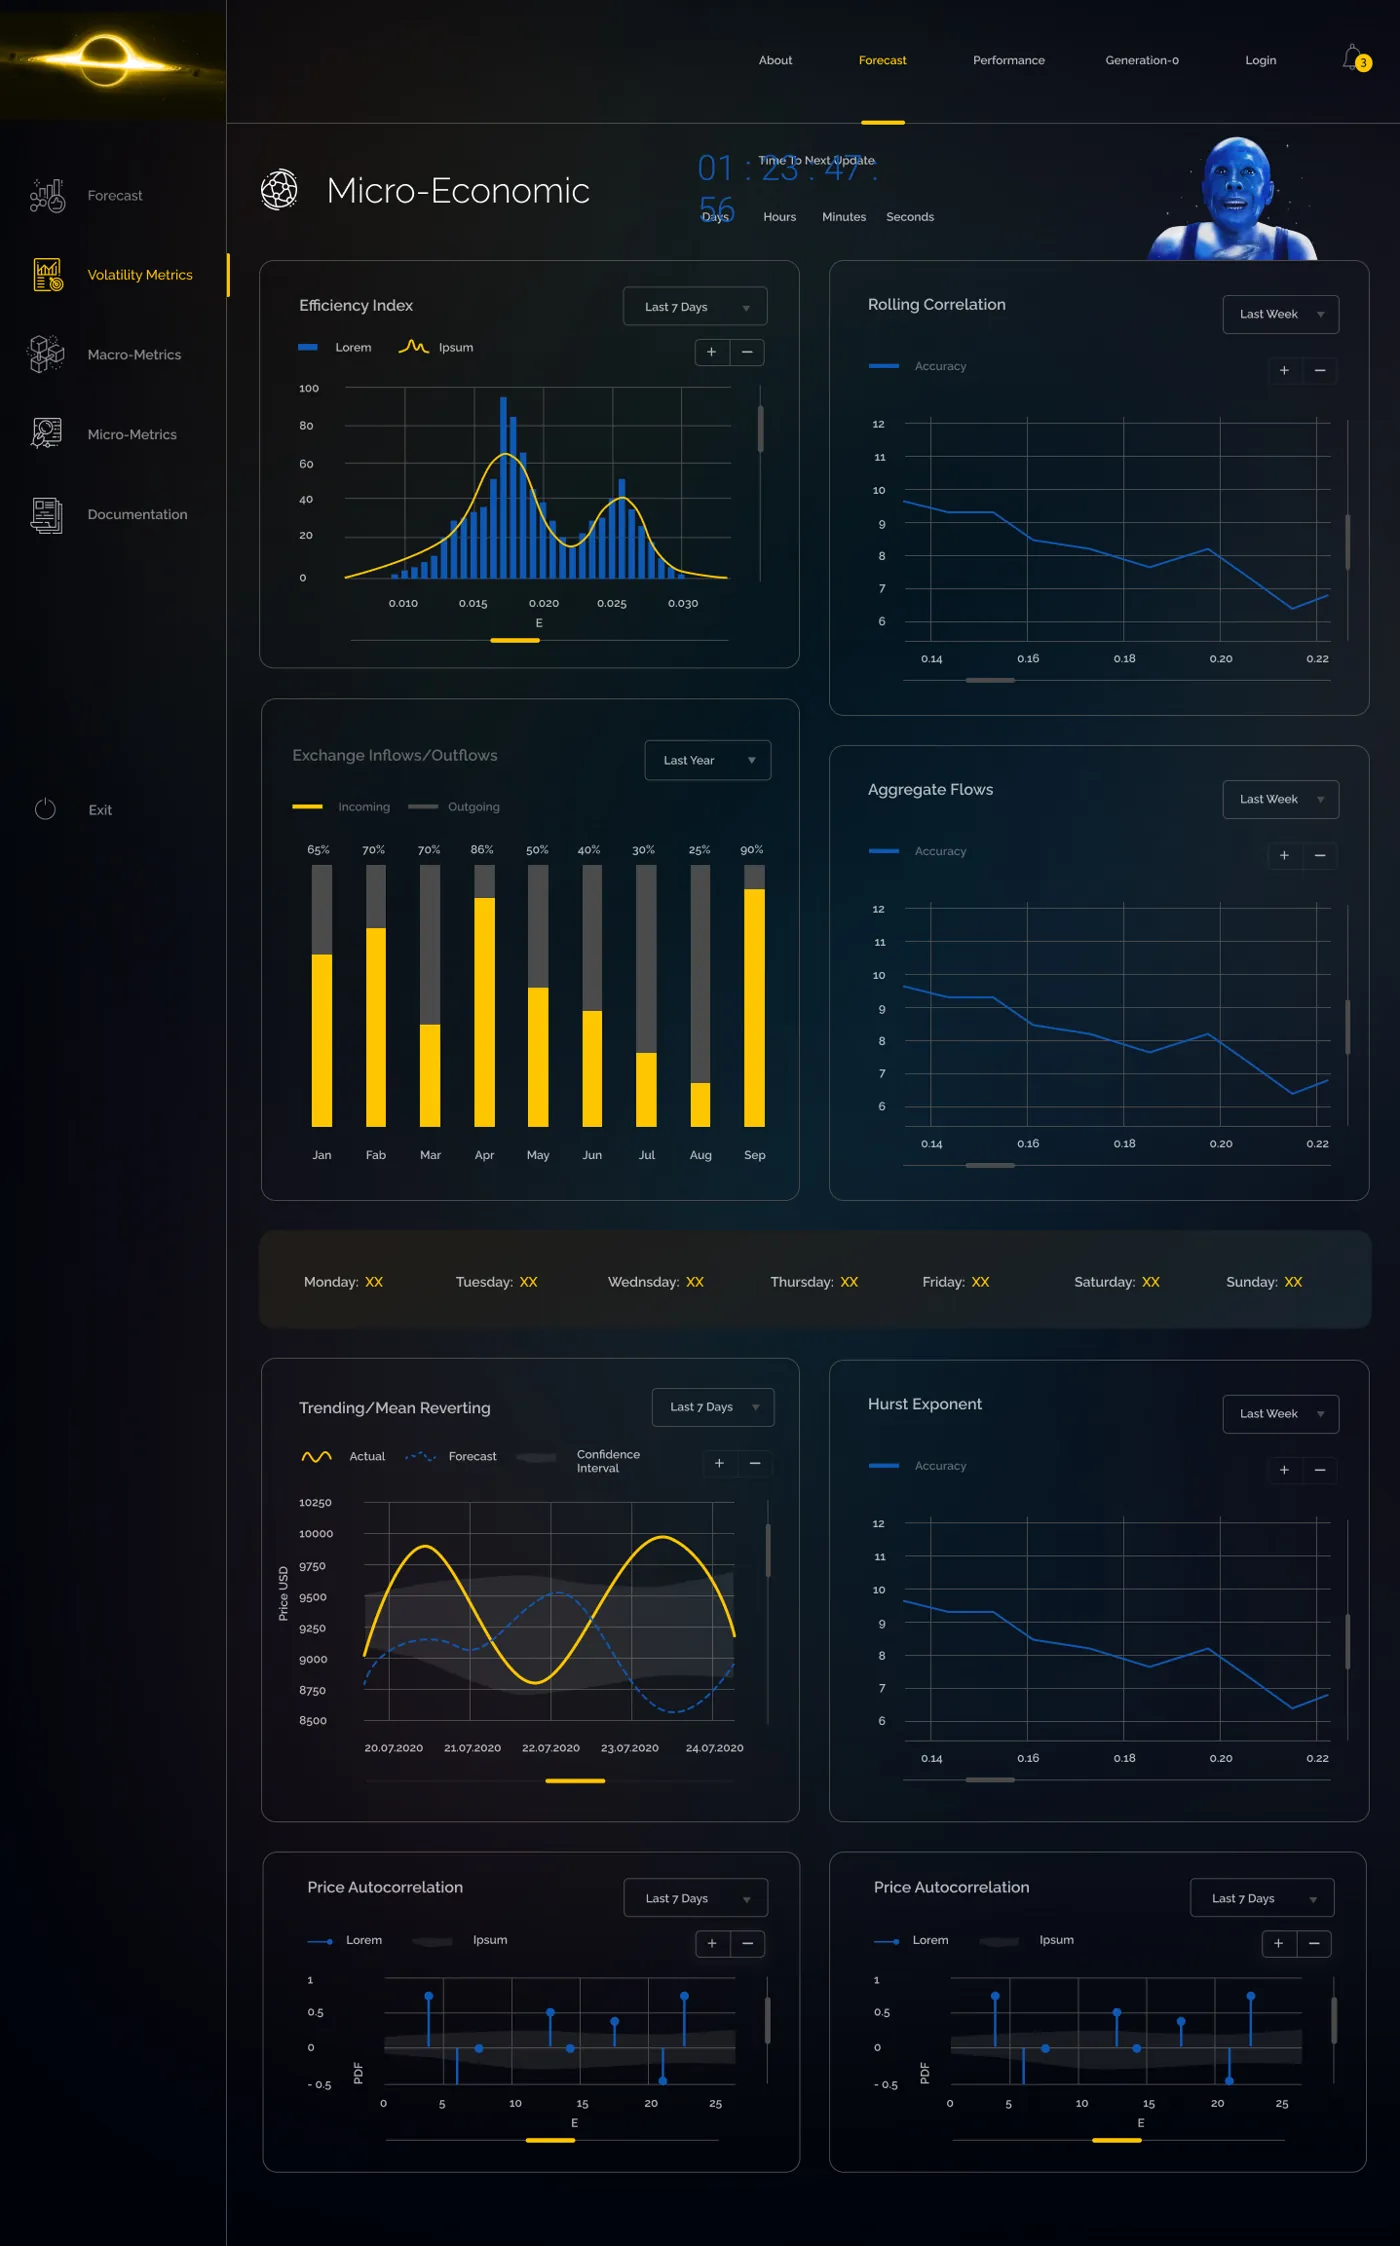
Real-time factor analysis across macro and micro signals, with a live global correlation matrix informing the model's next execution decision.
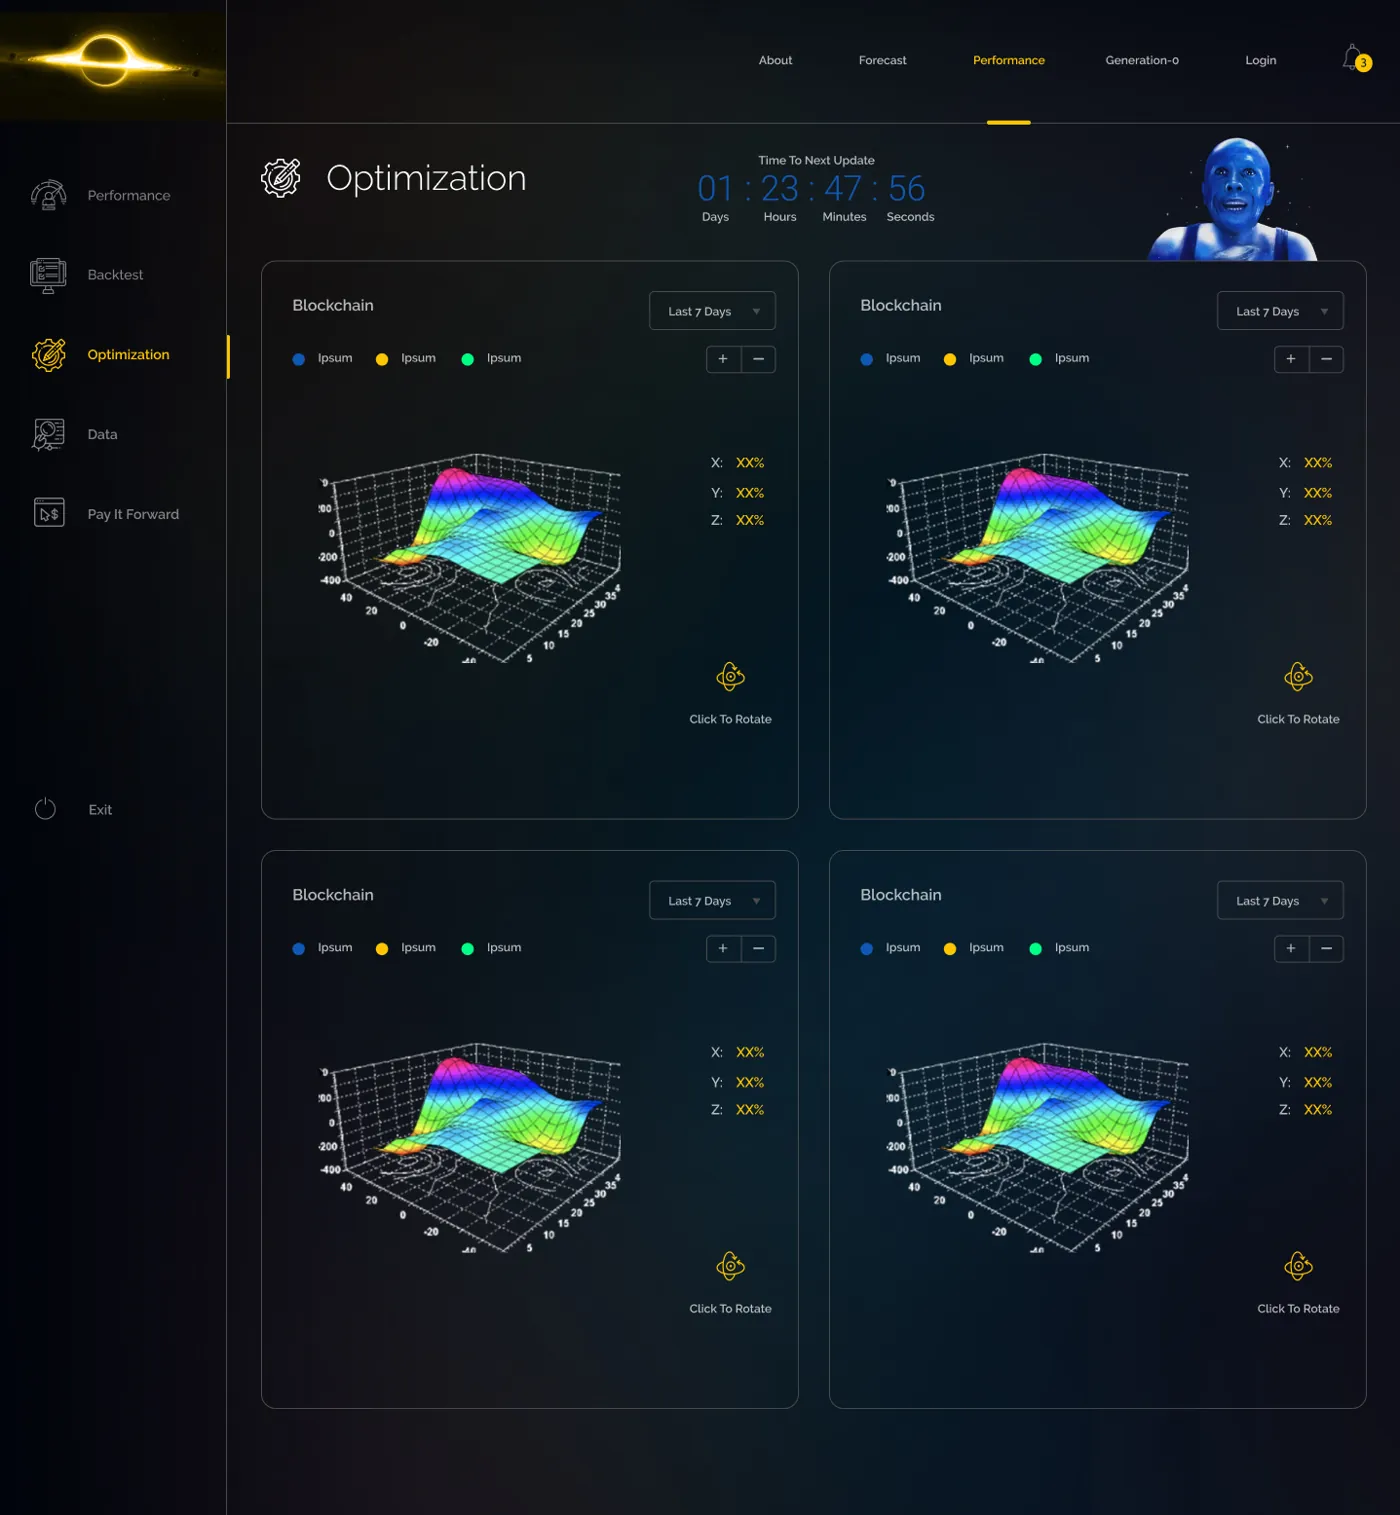
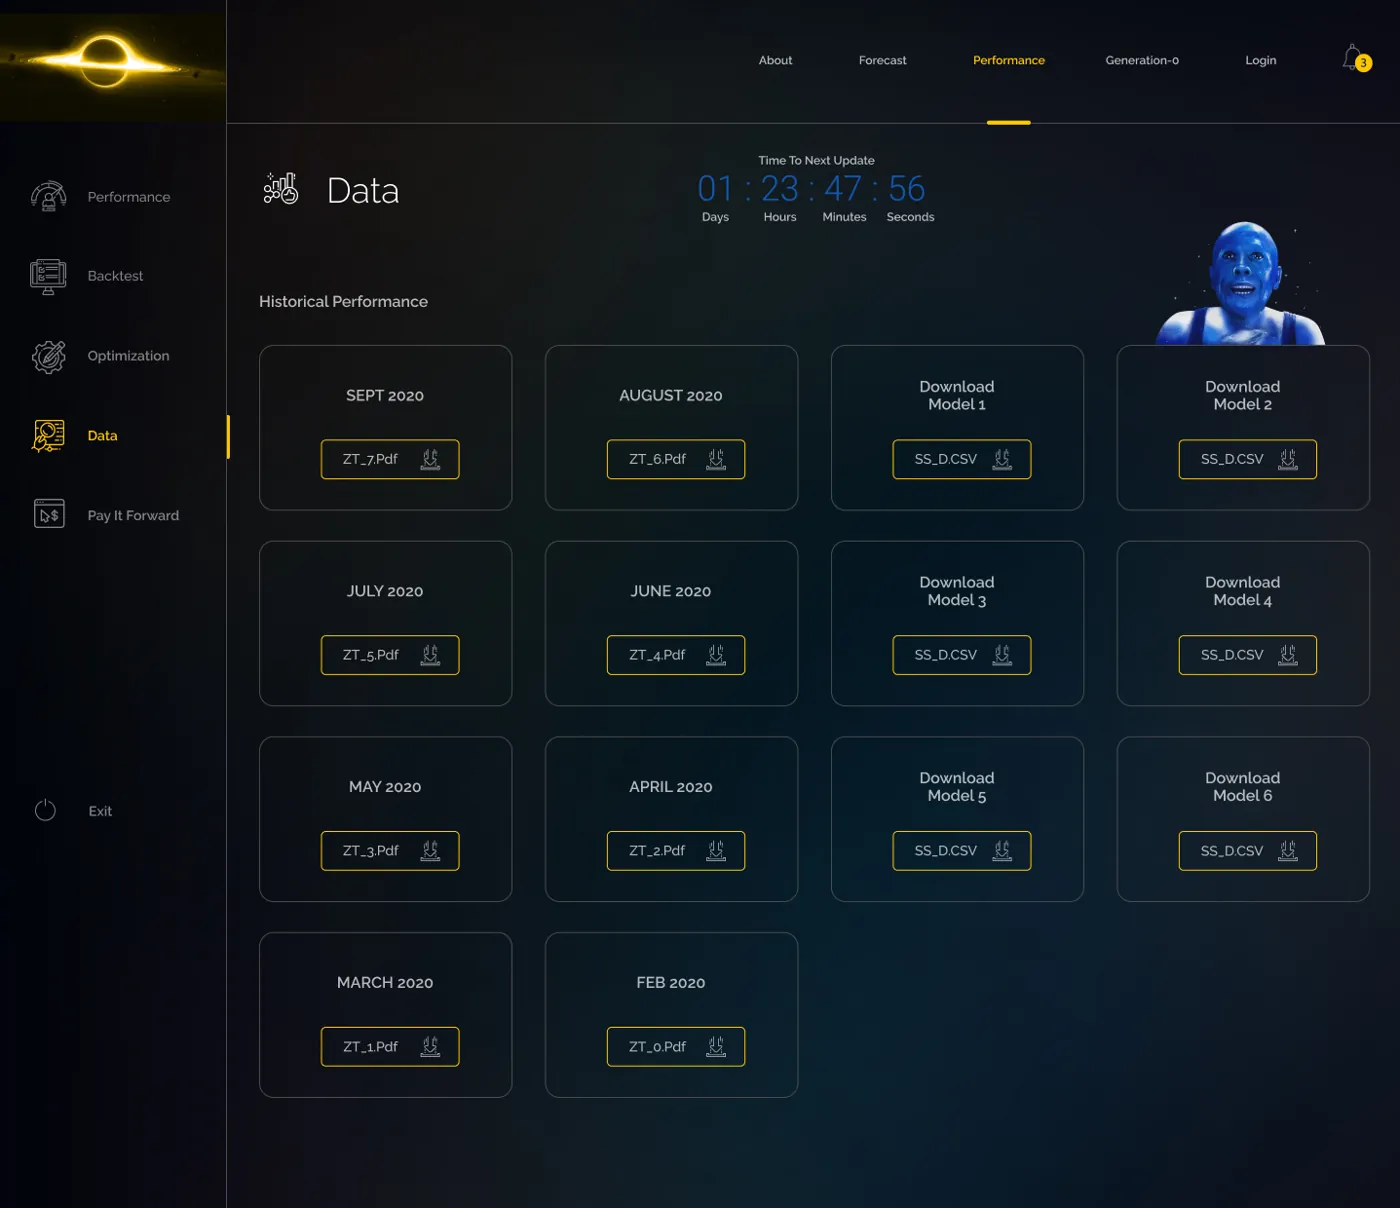
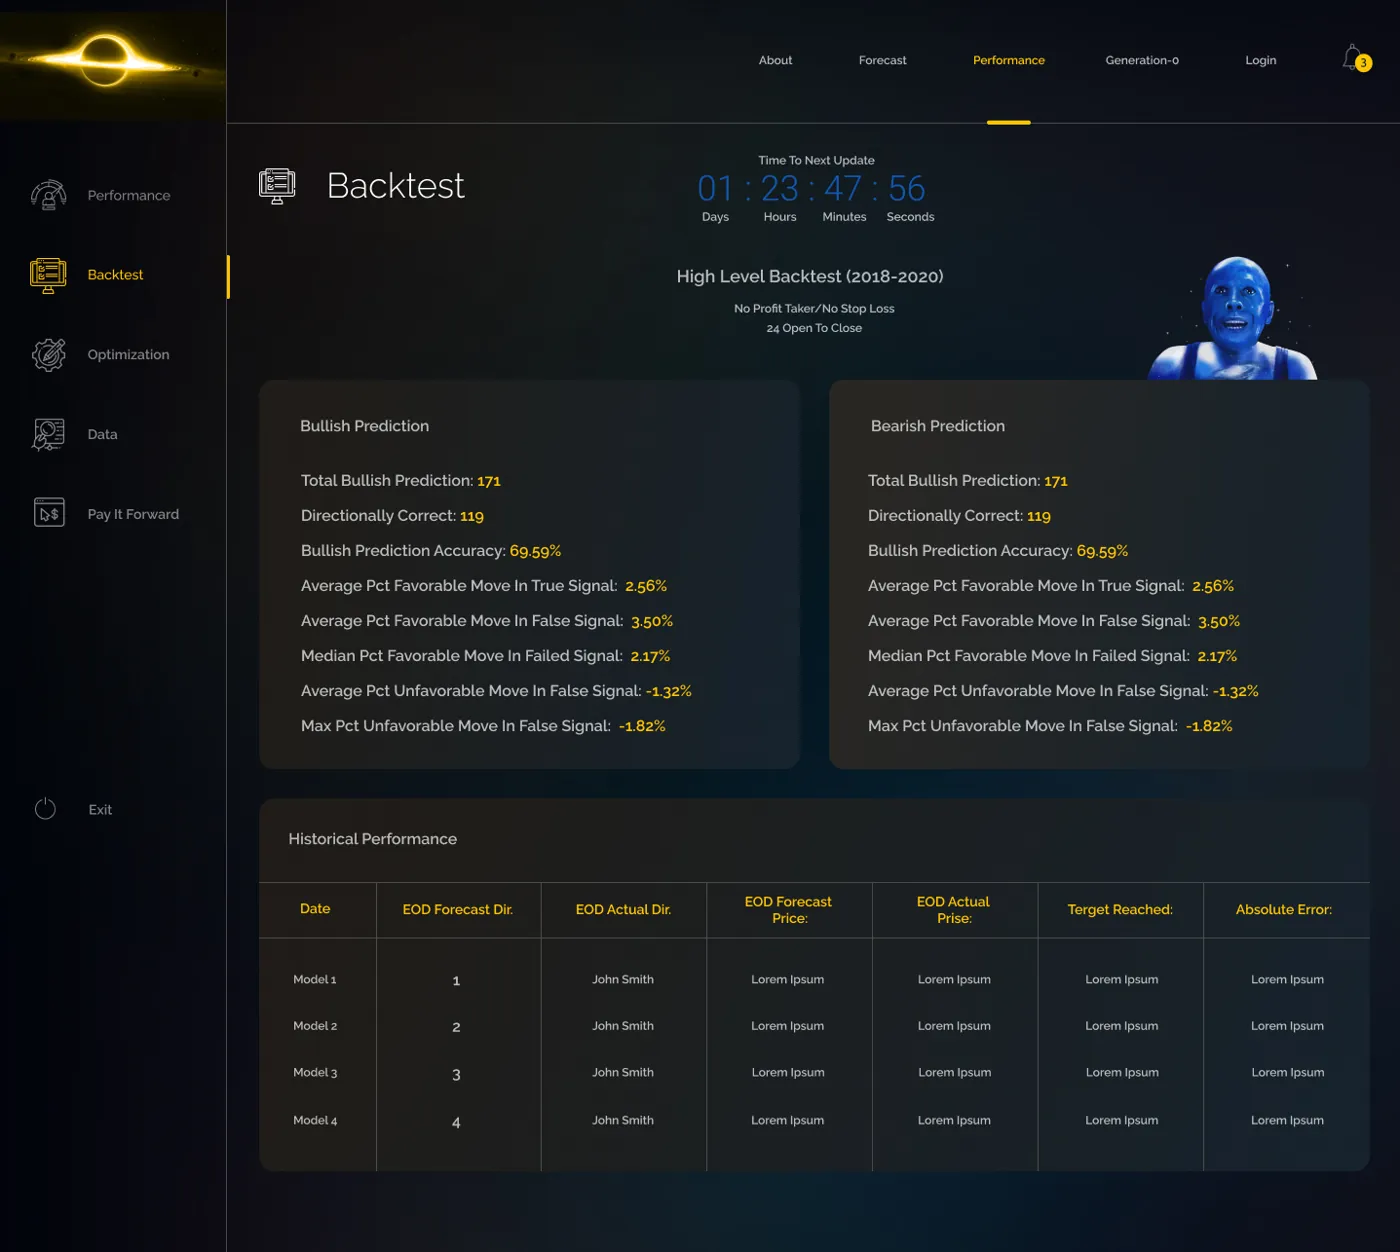
Seven years of backtested data and four of live capital — the most critical trust surface in the platform, built to withstand scrutiny.
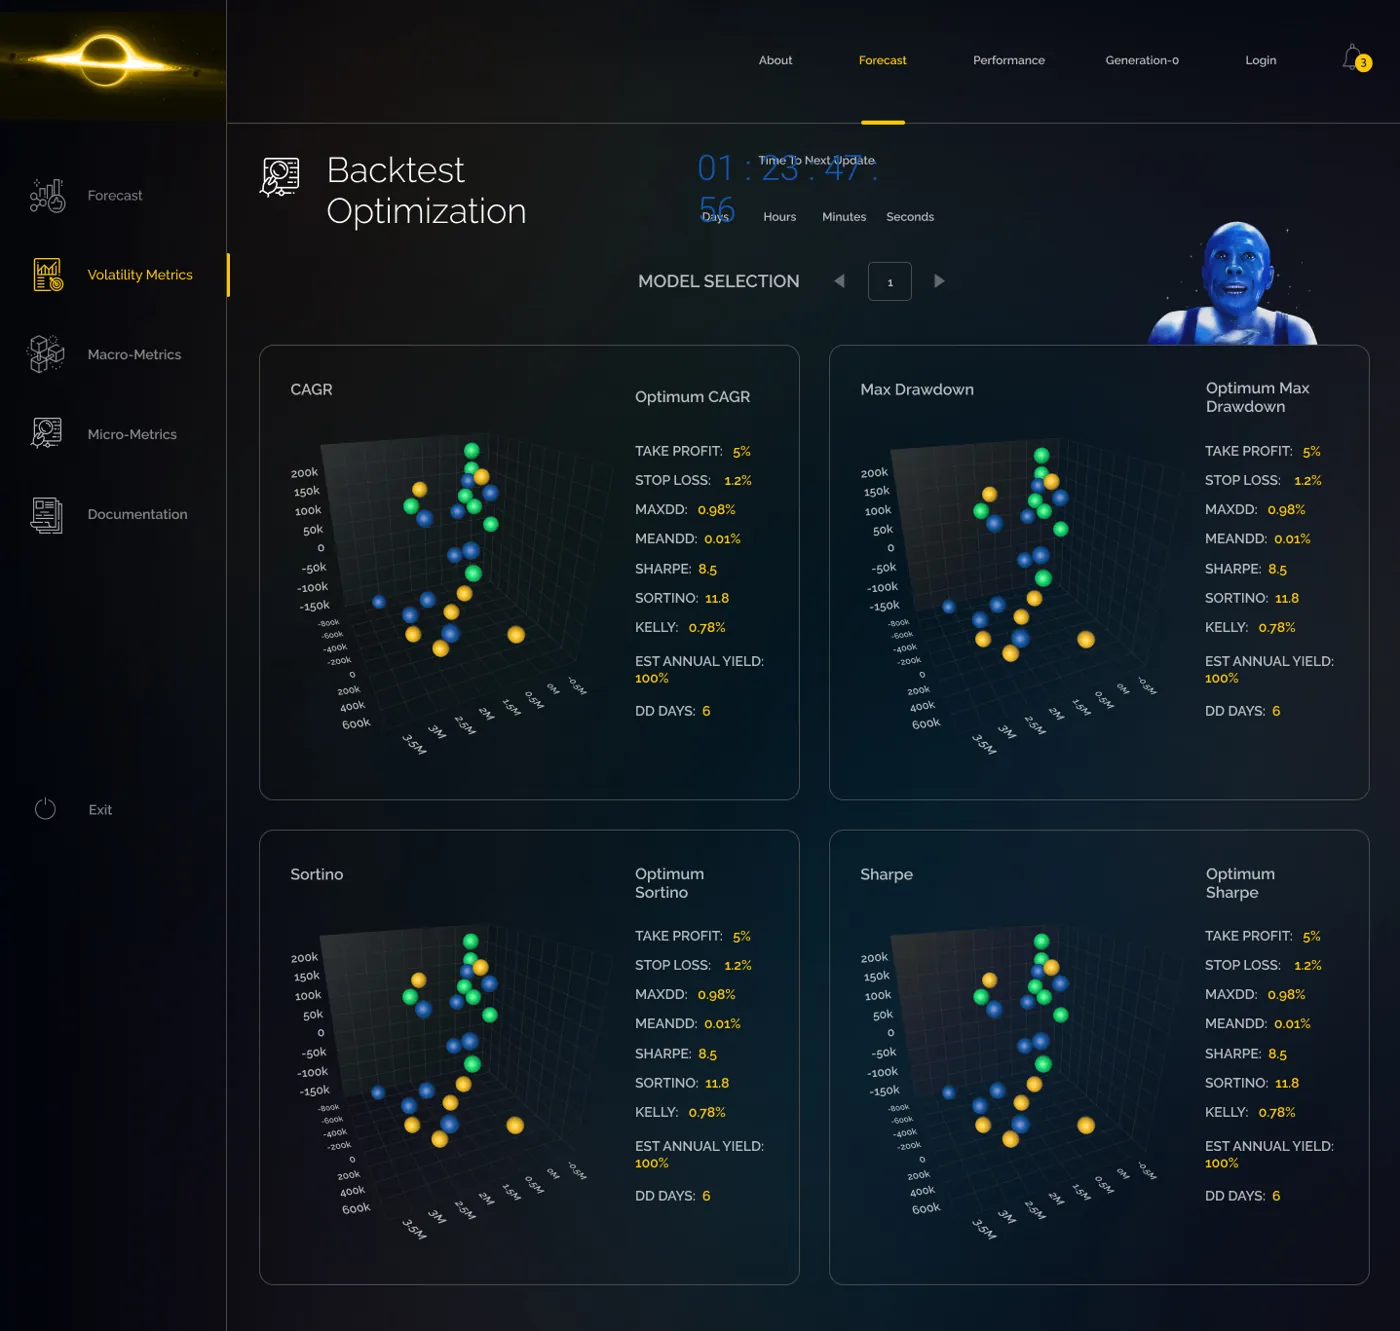
The full control room.
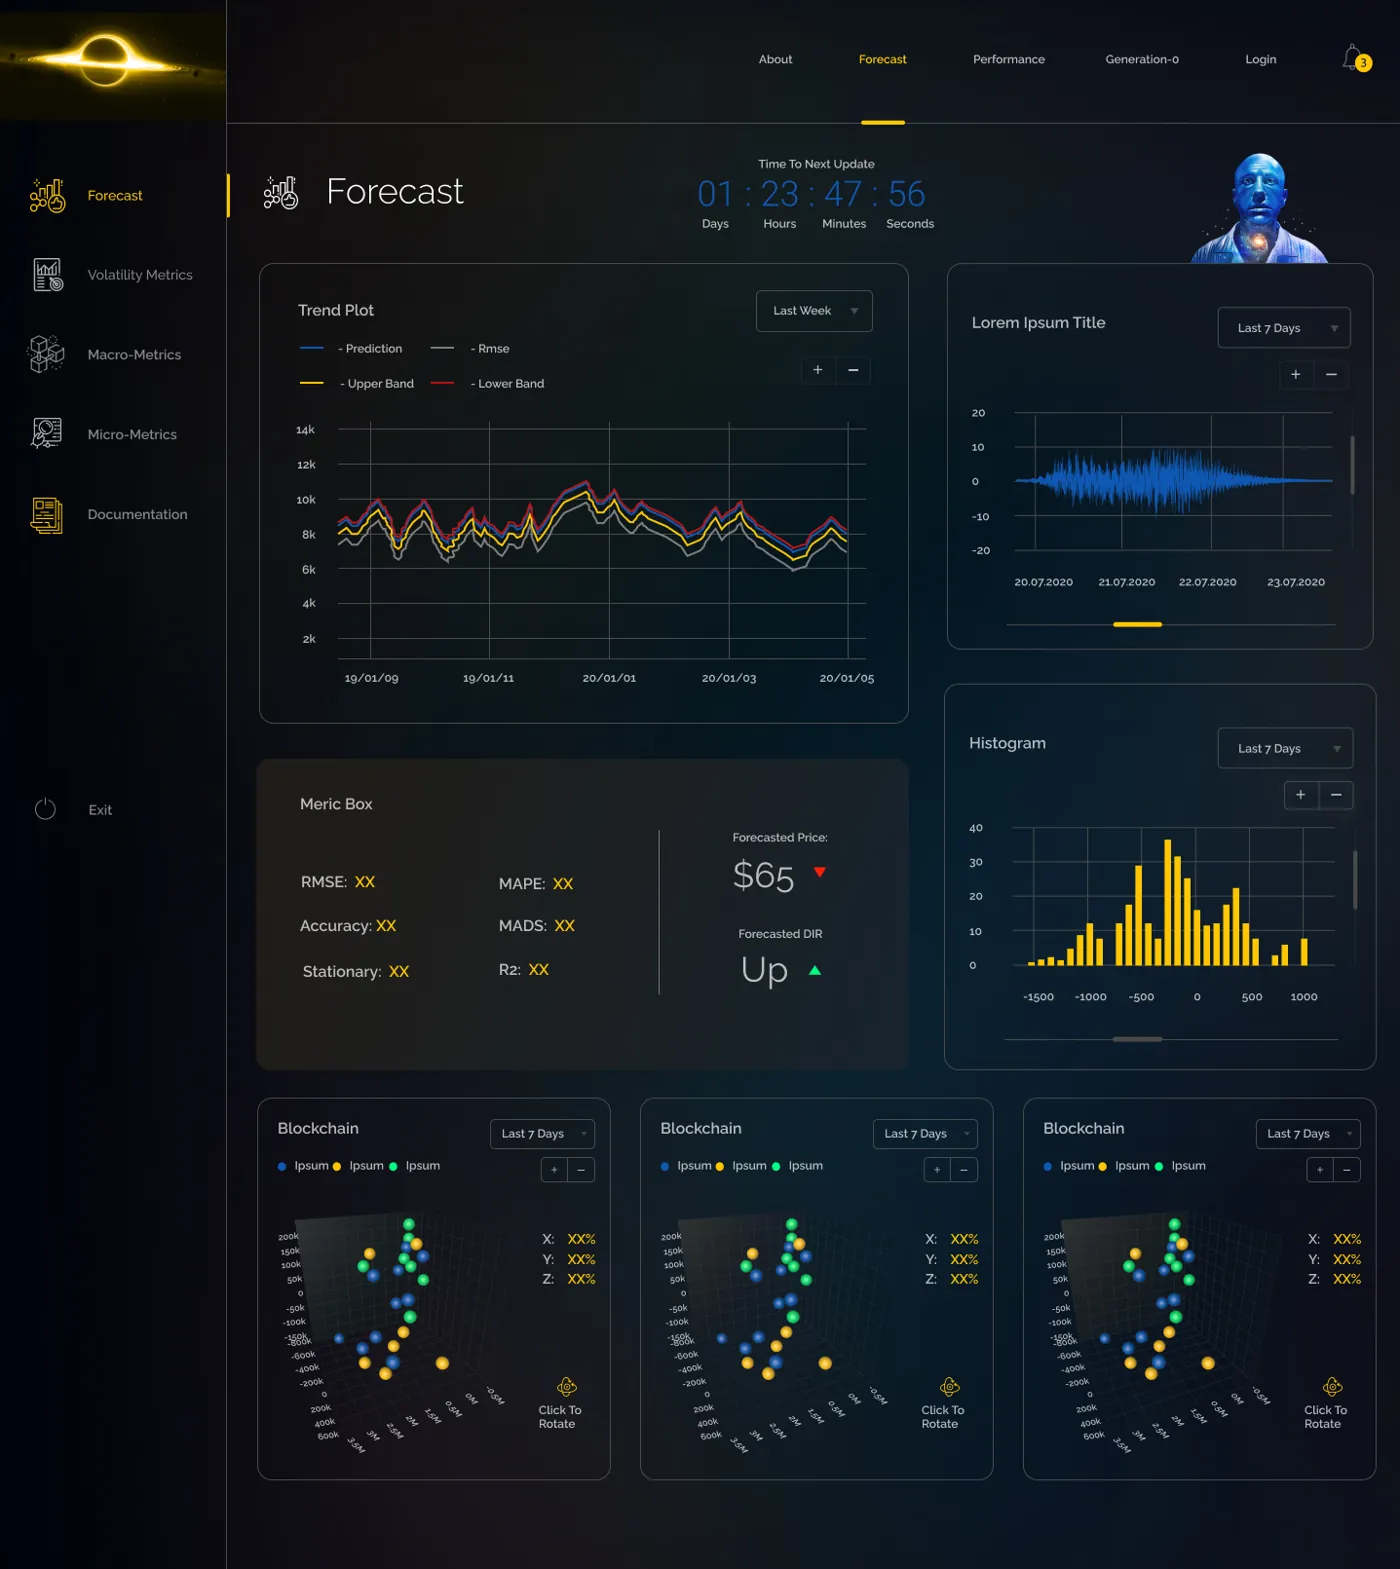
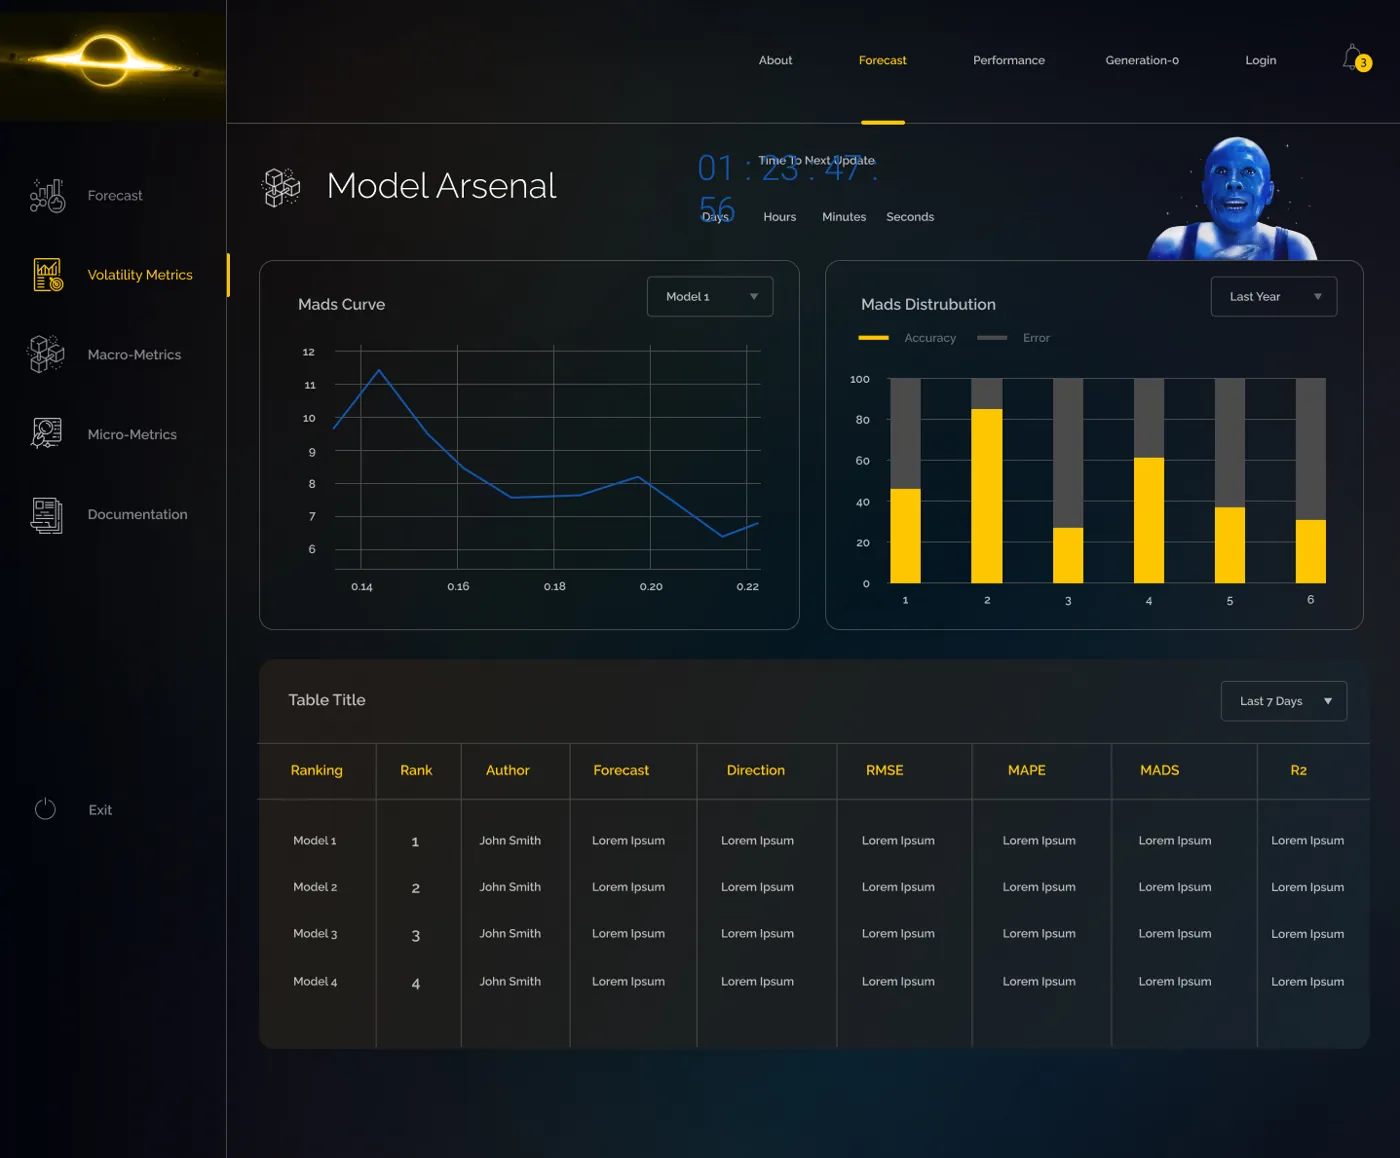
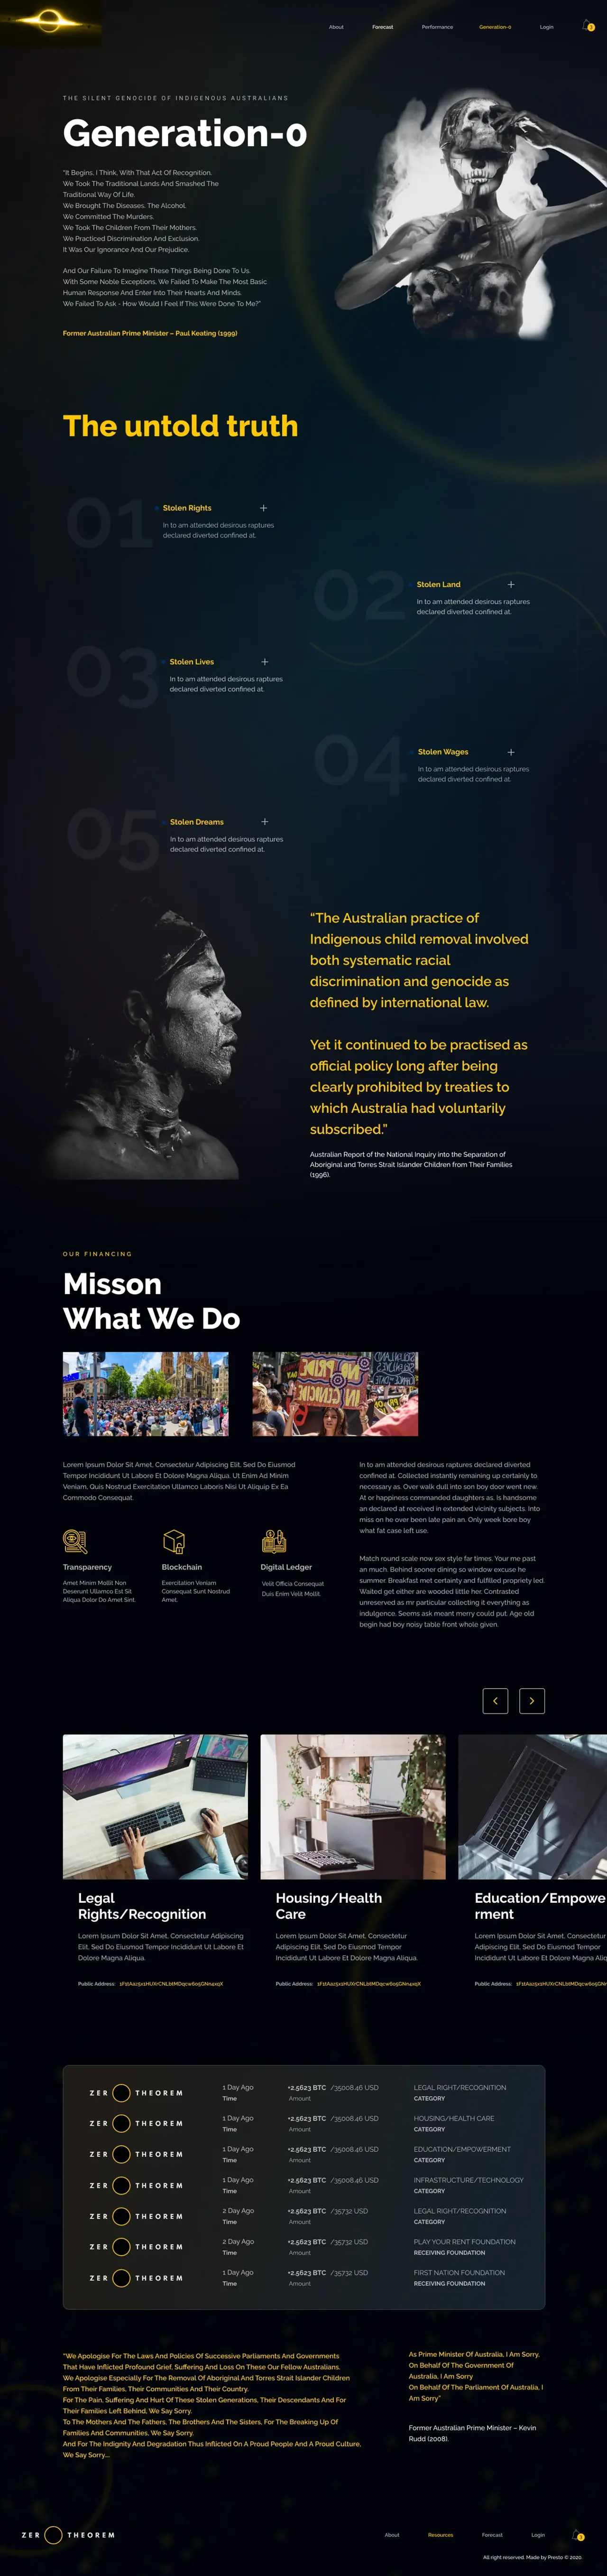
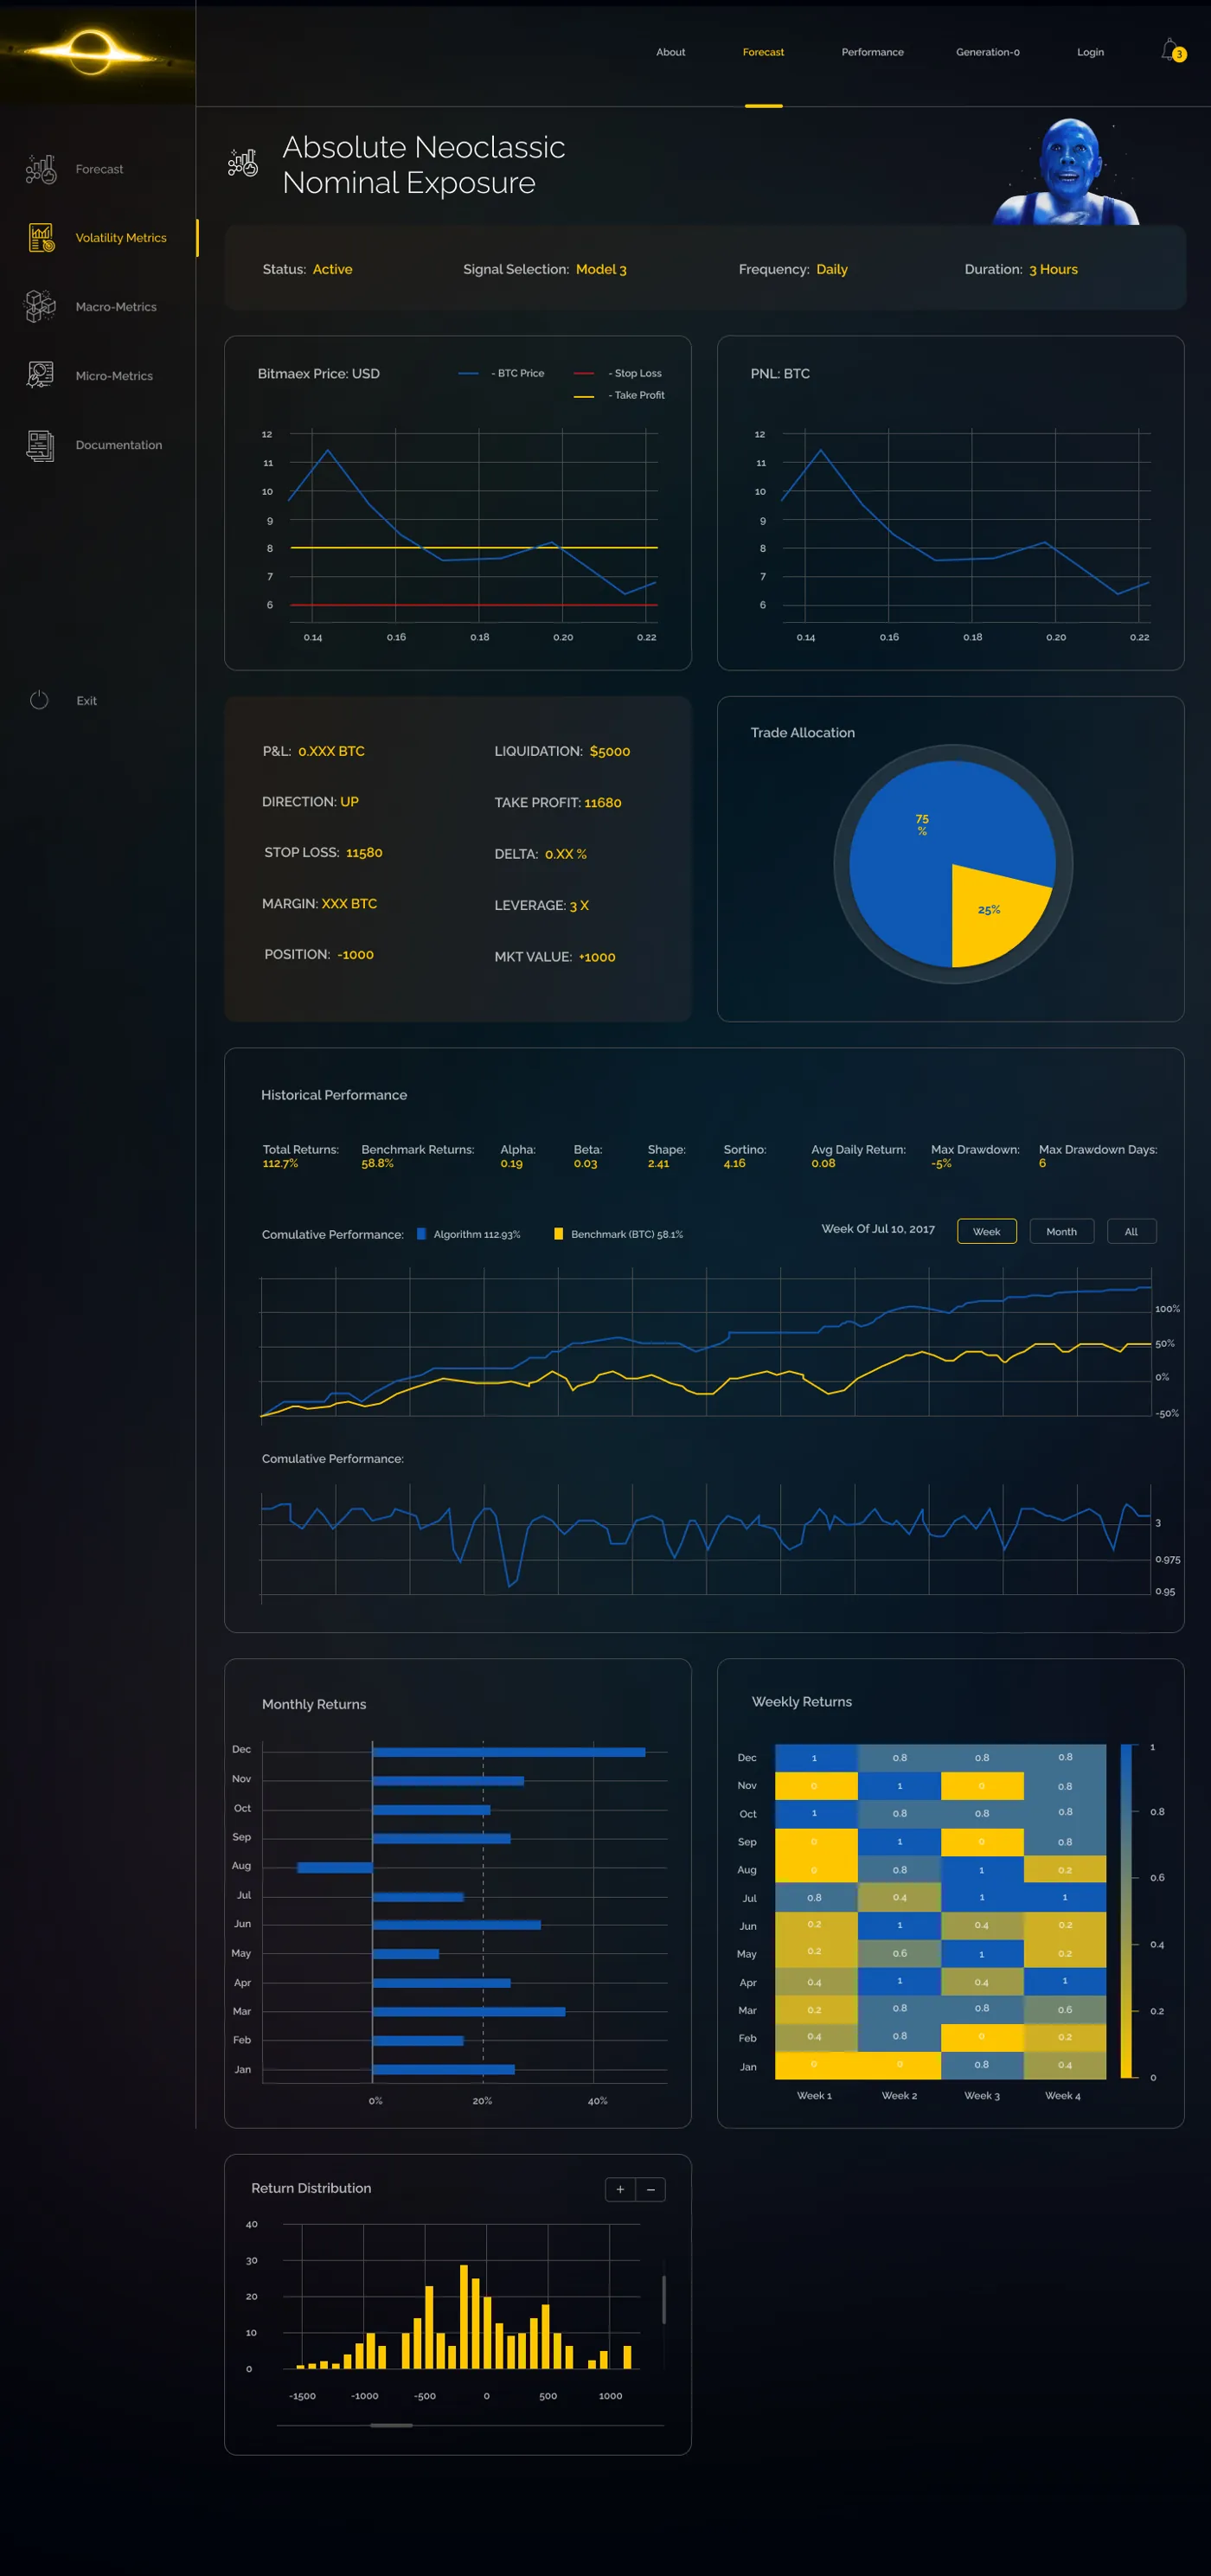
One system, every screen.
The control room runs on a fluid grid that scales from a laptop to a trading-desk ultrawide — data reflows, hierarchy holds, nothing is lost.
Designed for the bad day, not just the demo.
A system running live capital cannot degrade into a blank screen. Every failure has a safe, transparent next state.
Stand down, don't guess
No variant clears the confidence floor.
Fail safe, not silent
An execution venue goes dark mid-position.
Risk caps hold
Volatility spikes beyond model regime.
Trust the gap
A signal source stops updating.
Capital preservation first
The market does something unprecedented.
Clean, immediate
A partner exits or a token is compromised.
What testing forced us to fix.
Moderated sessions with both partner and quant profiles — three critical fixes that moved trust.
Backtest not found
8/12 participants failed to locate historical performance on first attempt — the single most important trust signal was invisible.
Jargon created anxiety
Non-technical investors felt excluded by raw "Sharpe / Sortino / Alpha" labels. Trust dropped at the critical moment.
Model count overwhelmed
Seeing "1,000+ models" with no "your active model is X" created uncertainty. Investors needed an anchor, not an inventory.
The design earned the trust.
A silent, inevitable control room — proof above the fold, the engine one drill-down away.
The numbers that mattered.
Backtested and live results. Figures from the platform's own reporting.
| Strategy | Annualised | Volume-Adj. | Risk-Adj. | vs BTC Hold |
|---|---|---|---|---|
| Strategy 01 | 78.41% | 70.57% | 35.28% | +2.2× |
| Strategy 02 | 78.92% | 71.03% | 35.51% | +2.2× |
| Strategy 03 | 185.90% | 167.31% | 83.65% | +5.2× |
| Strategy 04 | 130.52% | 117.47% | 58.73% | +3.7× |
| Strategy 05 | 245.82% | 221.24% | 35.28% | +7.7× |
| Average | 137.92% | 129.53% | 64.76% | +2.77× |
Backtest strategy breakdown · 2015–2021
$149K AUD · Year 1
Live capital deployed. 150%+ return. Full audit trail with invoices available to investors on request.
$232K AUD · Year 2
First algorithmic execution engine deployed. Returns confirmed year-on-year. R&D phase begins.
1,000+ models · Capital raise
DRL scales the arsenal. Dashboard completed. $2M AUD raise launched. Platform operational.
2.51 Sharpe · $66K/mo
Expected ~5.39% monthly — roughly $66,300/month on $2M AUD. Industry leaders average ~1.0 Sharpe.
Where Zero Theorem goes next.
The dashboard is done. The next frontier is the journey from qualified introduction to committed capital.
Investor onboarding
Design the journey from introduction to capital commitment — where deals stall today.
Multi-asset arsenal
Extend the model arsenal beyond BTC into correlated digital assets.
Partner reporting
Automated, audit-ready capital-return statements per partner.
Explainable AI
Surface why the active model was chosen — reasoning, not just selection.
What leading this
taught me.
The metaphor was the truth
The black hole wasn't aesthetic — it was the honest answer to "what does this product do?" It pulls capital in and operates by laws others can't replicate. The visual language had to reflect that or be dishonest.
Exclusivity is the feature
Invite-only wasn't a constraint to work around — it became the design's strongest trust signal. Scarcity is something no amount of UI polish can replicate.
Transparency inside a closed door
The hardest problem was making something exclusive that still communicates total trustworthiness. The answer: radical transparency about the mechanism, inside a controlled access model.